Arctic-Images
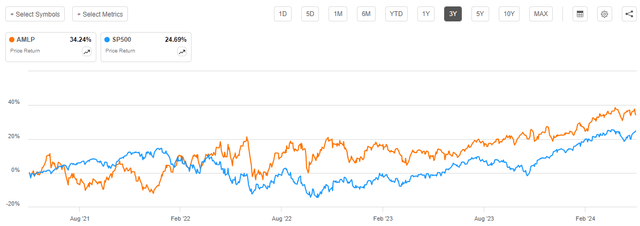
The NXG Cushing Midstream Energy Fund (NYSE:SRV) is a closed-end fund that income-seeking investors can employ as a method of accomplishing their goals of earning a high level of income from the assets that are present in their portfolios. The fund does this by investing in a portfolio of midstream partnerships, which is certainly very different from debt-focused closed-end funds that tend to dominate the portfolios of many investors who seek portfolio income. This is nice because the equities that are held by a fund like this provide exposure to much greater upside potential than fixed-income securities. In fact, midstream partnerships have outperformed the S&P 500 Index (SP500) over the past three years. We can see this by looking at the price performance of the Alerian MLP ETF (AMLP) compared to the large-cap index over the past three years:
The NXG Cushing Midstream Energy Fund invests in securities similar to the ones that are held by the Alerian MLP ETF, so we can see the potential for upside very quickly.
The NXG Cushing Midstream Energy Fund also delivers very well on the promise of providing a high level of income to its shareholders. At the current price, the fund boasts a 12.35% yield, which is higher than most of its peers:
Fund Name | Morningstar Classification | Current Yield |
NXG Cushing Midstream Energy Fund | Equity-MLP | 12.35% |
ClearBridge Energy Midstream Opportunity Fund (EMO) | Equity-MLP | 6.34% |
Kayne Anderson Energy Infrastructure Fund (KYN) | Equity-MLP | 8.95% |
Neuberger Berman Energy Infrastructure and Income Fund (NML) | Equity-MLP | 9.05% |
Tortoise Midstream Energy Fund (NTG) | Equity-MLP | 7.74% |
Long-time readers will quickly notice that there are far fewer funds in this category than there used to be. One of the biggest reasons for this is that closed-end funds in the energy infrastructure space have not seen their share prices perform anywhere near as well as the underlying portfolio for many years. This situation has prompted fund houses to merge funds together or convert them into an exchange-traded fund structure to try and better deliver value to their shareholders. We have discussed this in a few past articles on the Kayne Anderson Energy Infrastructure Fund and the various First Trust energy infrastructure funds that used to trade in the market. The fact that the market tends to underappreciate these funds is not necessarily a reason for investors to avoid purchasing shares of the NXG Cushing Midstream Energy Fund though, as the fund’s yield alone is more than capable of providing investors with an attractive return.
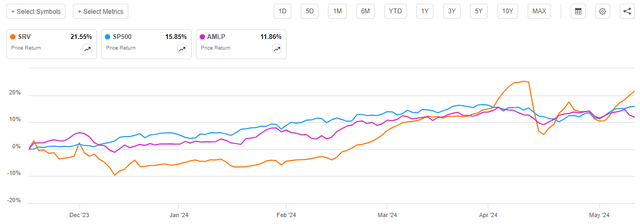
As regular readers might remember, we previously discussed the NXG Cushing Midstream Energy Fund in the middle of November 2023. Midstream companies, along with most other common equities, have generally done reasonably well since that time. As such, we can expect that the fund itself will have performed well. This assumption proves to be correct, as the fund’s share price has increased by 21.55% since that date:
We can immediately see that the share price of the NXG Cushing Midstream Energy Fund managed to outperform both the Alerian MLP Index and the large-cap stock index. As such, the fund’s recent market performance certainly will not be disappointing to anyone who purchased the fund on the date that my prior article on it was published.
However, as I stated in a previous article:
A simple look at a closed-end fund’s price performance does not necessarily provide an accurate picture of how investors in the fund did during a given period. This is because these funds tend to pay out all of their net investment profits to the shareholders, rather than relying on the capital appreciation of their share price to provide a return. This is the reason why the yields of these funds tend to be much higher than the yield of index funds or most other market assets.
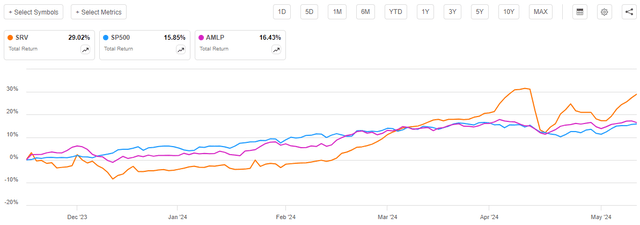
When we include the distributions paid out by the assets shown in the chart above, we get this chart:
As we can see, the S&P 500 Index actually ends up being the worst performer over the past six months when distributions are considered. This is because the higher yields of both the Alerian MLP Index and the NXG Cushing Midstream Energy Fund boost their performance relative to the index. The best performer over the period remains the NXG Cushing Midstream Energy Fund by a considerable margin, however. This certainly explains why this fund is one of the most popular energy infrastructure closed-end funds on the market, and its performance is obviously strong enough to satisfy the most discerning investor in search of income.
As we are all very well aware, though, a fund’s past performance is no guarantee of its future results. As such, we should have a look at the fund as it stands today in order to determine whether or not it still makes sense to hold a position in it. The remainder of this article will be devoted to that discussion.
About The Fund
According to the fund’s website, the NXG Cushing Midstream Energy Fund has the primary objective of providing its investors with a high level of after-tax total return. Specifically, the website states:
The Fund’s investment objective is to obtain a high after-tax total return from a combination of capital appreciation and current income. The Fund seeks to achieve its investment objective by investing, under normal conditions, at least 80% of its net assets, plus any borrowings for investment purposes, in midstream energy investments.
As I pointed out in my previous article on this fund:
For the most part, the common equity of midstream energy companies is a total return vehicle, so the investment objective makes a great deal of sense. After all, investors purchase shares of these companies in order to receive current income via the high dividends and distributions that they pay out. The investor is also looking to earn a certain amount of capital gains as the issuing company grows and prospers with the passage of time.
However, some eagle-eyed readers might notice that the fund’s description of its investment strategy does not specifically state that the fund will only be investing in common equity. After all, midstream energy corporations and partnerships issue preferred equity and bonds in addition to the common equity that we are all familiar with. If the fund were to purchase a fixed-income security issued by one of these companies, it would still be able to claim that it is investing in midstream energy companies.
With that said, the fund’s annual report states that its portfolio consisted of the following on November 30, 2023:
Security Type | % of Net Assets |
Common Stock | 78.5% |
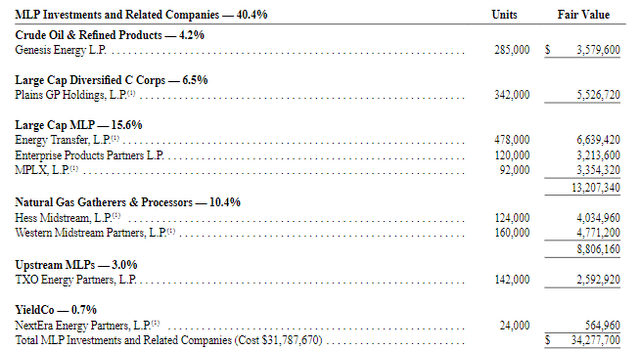
MLP Investments and Related Companies | 40.4% |
Preferred Stock | 3.0% |
Money Market Funds | 3.6% |
The “MLP Investments and Related Companies” allocation entirely consists of the common limited partnership units (common equity) issued by master limited partnerships:
Thus, the only holdings that the fund had on November 30, 2023, that were not common equities were the small allocations to preferred stocks and money market funds. Every closed-end fund is going to have a small allocation to money market funds, as that is the fund’s cash position. We can therefore exclude that from consideration completely, which leaves us with the 3.0% allocation to preferred stock as the only non-common equity asset. That is not a large enough weighting to really have a significant impact on the performance of the portfolio, so overall we can expect this fund to perform like a common equity fund. Based on the performance that it has delivered over the past six months; this is a correct assumption.
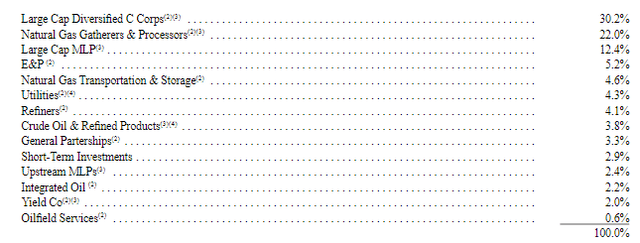
The website specifically states that the fund is investing in midstream companies. However, it does have some assets that are not in those categories. The annual report provides the following sector weightings:
The large-cap MLPs and the natural gas gatherers & processors are all midstream companies, as are the natural gas transportation & storage companies. The crude oil & refined products companies are mostly midstream firms as well, as the two companies defined as this contained in the fund are Genesis Energy (GEL) and NGL Energy Partners (NGL). The fund’s schedule of investments states that the NGL Energy Partners position is preferred equity though, although it does not state whether or not it holds the Class B or the Class C preferred units. The large-cap diversified C-Corps are mostly midstream companies, although Cheniere Energy (LNG) is listed as one of its positions in that sector and Cheniere Energy is arguably not a midstream company.
Thus, we can see that the fund does not entirely consist of midstream companies, but its midstream allocation still appears to be around 70% to 75%, depending on exactly what firms we consider to be midstream companies. Investopedia defines midstream companies as:
Midstream is a term used to describe one of the three major stages of oil and gas industry operations. Midstream activities include the processing, storing, transporting, and marketing of oil, natural gas, and natural gas liquids.
That definition is somewhat confusing because refineries technically process crude oil, but they are not considered to be midstream companies. The downstream segment starts when the products reach the refinery. The downstream segment also includes things like refined product pipelines and the processing of natural gas (which is normally done by midstream companies). Thus, there is a great deal of overlap, and most of the largest companies that we would normally consider to be midstream firms actually operate in both the midstream and the downstream segments. This is important because downstream companies are more affected by movements in energy prices than midstream pipeline and storage companies. I explained the basic business model for midstream companies in my previous article on the NXG Cushing Midstream Energy Fund:
In short, a midstream company enters into long-term contracts with its customers under which the midstream company transports or stores hydrocarbon resources owned by its customers. In exchange, the customer compensates the midstream company based on the volume of the resources that the midstream company handles, not on the value of these resources. This provides the midstream company with a substantial amount of insulation against changes in energy prices. In addition, the contracts frequently include minimum volume commitments that require the customer to send a specific volume of resources through the midstream company’s infrastructure or pay for it anyway. This protects the midstream company’s cash flow against changes that may occur in resource production due to macroeconomic changes or energy prices fluctuations.
Downstream operations such as refineries and natural gas processing companies, meanwhile, frequently operate a margin-based business model. The company purchases unprocessed products, processes or refines them, and then sells the finished product. This causes both revenue and cost of goods sold to vary with resource prices, but the hope is that the spread between the raw resources and the refined products remains relatively stable over time. This is somewhat true, but overall, these companies are still more affected by energy prices and the demand for hydrocarbon products than pipeline operators.
As such, midstream companies tend to be somewhat more stable than downstream companies. As mentioned though, many of the larger midstream companies actually operate in both segments. The NXG Cushing Midstream Energy Fund seems to invest primarily in midstream companies, but it does have some exposure to both the upstream and the downstream segments. As such, we can expect that the companies that it holds will be reasonably stable over time, but they will still be affected by energy prices. As many income-focused investors like their principal to remain relatively stable, this is something that we need to keep in mind.
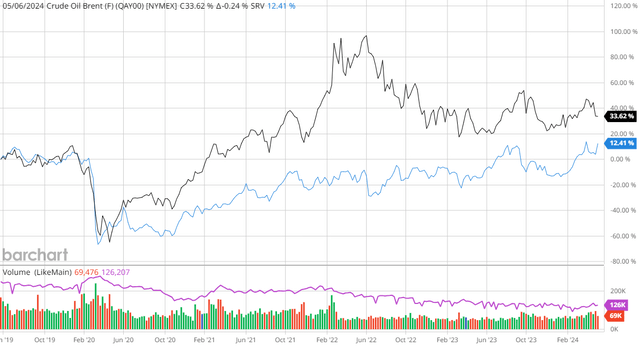
We do, in fact, see a certain degree of correlation between energy prices and this fund’s share price. This chart shows the spot price of Brent crude oil and the share price of the NXG Cushing Midstream Energy Fund over the past five years:
The black line in the graph shows the spot price of Brent crude oil. The blue line shows the fund’s share price. We can see that the fund’s shares generally exhibited much less volatility than the commodity price, but the directional movements were generally pretty similar. Perhaps the major difference comes from the fact that this fund did not recover as rapidly from the energy price collapse that accompanied the COVID-19 pandemic, but that is fairly common among all midstream closed-end funds. For the most part, we can see the combination of stability and correlation to energy prices that we would expect given this fund’s portfolio composition.
As long-time readers are no doubt well aware, I have devoted a considerable amount of time and effort over the years to discussing traditional upstream, midstream, and downstream energy companies both here at Energy Profits in Dividends and on Seeking Alpha. As such, most readers should be very familiar with the largest positions in the fund’s portfolio. Here they are:
NXG Cushing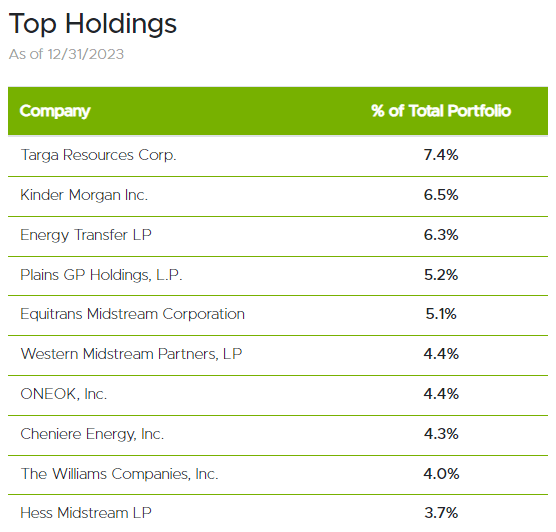
I have discussed every one of these companies at some point in the past, except for Western Midstream Partners (WES). For the most part, they are all relatively solid companies and good representatives for the energy infrastructure sector as a whole. The majority of these companies also have reasonably attractive yields, as can be seen here:
Company | Current Yield |
Targa Resources Corp. (TRGP) | 2.65% |
Kinder Morgan Inc. (KMI) | 6.03% |
Energy Transfer LP (ET) | 7.97% |
Plains GP Holdings L.P. (PAGP) | 6.34% |
Equitrans Midstream Corporation (ETRN) | 4.58% |
Western Midstream Partners | 9.66% |
ONEOK, Inc. (OKE) | 4.95% |
Cheniere Energy, Inc. | 1.11% |
The Williams Companies, Inc. (WMB) | 4.79% |
Hess Midstream LP (HESM) | 7.43% |
As of the time of writing, the S&P 500 Index has a 1.47% dividend yield, so every company on this list except for Cheniere Energy has a yield that exceeds the market as a whole. This is rather nice from the perspective of an income investor, since it means that these companies should be able to provide the fund with a fairly high level of income that it can pass through to its shareholders. It also means that the fund does not need to earn a substantial amount of capital gains from its assets in order to earn an attractive total return.
There have been surprisingly few changes to the fund’s holdings over the six months since we last discussed it. Indeed, the only notable changes to the fund’s largest positions list are that both TC Energy Corporation (TRP) and DT Midstream (DTM) were removed and replaced with Kinder Morgan and Equitrans Midstream. We also see that the order and weightings of several of the fund’s largest positions have changed, but that could be explained by one company’s equity outperforming another in the marketplace. A simple weighting change is not necessarily a sign that the fund is actively trading the assets in its portfolio in order to change the weights. However, this fund had a 161.58% annual turnover in the full-year period that ended on November 30, 2023, so it is certainly engaging in much more trading activity than we would expect given the small number of changes to the portfolio’s largest positions list.
The NXG Cushing Midstream Energy Fund has a substantially higher turnover than any of its peers:
Fund Name | Annual Turnover |
NXG Cushing Midstream Energy Fund | 161.58% |
ClearBridge Energy Midstream Opportunity Fund | 91.00% |
Kayne Anderson Energy Infrastructure Fund | 48.80% |
Neuberger Berman Energy Infrastructure and Income Fund | 20.00% |
Tortoise Midstream Energy Fund | 72.67% |
(All figures are from the most recent annual report for each of the respective funds).
The fact that this fund has a much higher turnover is something that cost-sensitive investors may wish to pay attention to, since asset trading costs the fund money. This fund only had a 3.43% expense ratio in the most recent fiscal year though, which is not really that bad:
Fund Annual Report
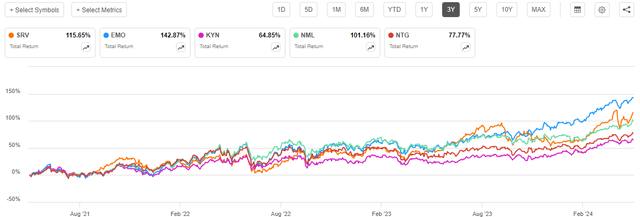
The fund’s high turnover appears to be due to it realizing capital gains in order to increase the amount of money that it can distribute to the investors. This is not necessarily a bad thing, particularly given that the fund’s trailing three-year total return is reasonably on par with its peers:
The fund’s trailing performance certainly explains its popularity with investors in this sector, as the only fund that managed to outperform it has a substantially lower distribution yield.
Leverage
As is the case with most closed-end funds, the NXG Cushing Midstream Energy Fund employs leverage as a method of boosting the effective total return that it earns from the assets in its portfolio. I explained how this works in my previous article on this fund:
In short, the fund is borrowing money and using that borrowed money to purchase the common equity of midstream companies. As long as the purchased assets have a higher total return than the interest rate that the fund needs to pay on the borrowed funds, the strategy works pretty well to boost the effective yield of the portfolio. As this fund is capable of borrowing money at institutional rates, which are considerably lower than retail rates, this will usually be the case. It is worth noting that this strategy is much less effective at boosting the effective portfolio return today than it was three years ago. This is simply because borrowing money is considerably more expensive today than it used to be.
However, the use of debt in this fashion is a double-edged sword. This is because leverage boosts both gains and losses. As such, we want to ensure that the fund is not using too much leverage because that would expose us to an excessive amount of risk. I generally do not like to see a fund’s leverage exceed a third as a percentage of its assets for this reason.
As of the time of writing, the NXG Cushing Midstream Energy Fund has leveraged assets comprising 25.86% of its portfolio. This is considerably higher than the 14.07% leverage ratio that the fund had at the time of our previous discussion, although it is in line with the trend that this fund has been showing over the past few months. As I pointed out in my last article on this fund, the leverage ratio of this fund has apparently been increasing over the past several quarters. This suggests that it is borrowing additional money to try and take advantage of the market strength that we have seen in the midstream sector since 2021. The addition of more leverage does, after all, boost the effective return that the fund earns from its assets.
Here is how the fund’s leverage compares to that of its peers:
Fund Name | Leverage Ratio |
NXG Cushing Midstream Energy Fund | 25.86% |
ClearBridge Energy Midstream Opportunity Fund | 27.70% |
Kayne Anderson Energy Infrastructure Fund | 21.32% |
Neuberger Berman Energy Infrastructure and Income Fund | 17.45% |
Tortoise Midstream Energy Fund | 18.90% |
(All figures from CEF Data).
As we can see, the fund’s leverage is higher than that of many of its peers, but it is not the highest level of leverage possessed by funds across the sector. This is a sign that the fund is probably not using too much leverage and exposing its shareholders to unnecessary risk. It is also well below the one-third level that we ordinarily prefer for a closed-end fund.
One thing that readers might note is that the two funds with the highest leverage ratios were also the two best performers over the period. This is the benefit that leverage provides.
Overall, it appears that the fund’s current level of leverage strikes a reasonable balance between risk and potential return. However, as this is one of the more highly leveraged funds in the sector, more risk-averse investors may want to choose a peer fund. While the fund’s peers will probably underperform if the bull market for midstream assets continues, they also will not have the downside risk of this fund in the event of a market correction.
Distribution Analysis
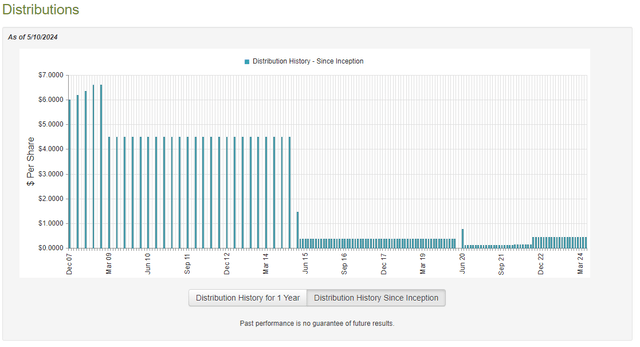
As mentioned earlier in this article, the primary objective of the NXG Cushing Midstream Energy Fund is to provide its investors with a high level of total return through a combination of both capital appreciation and current income. To this end, the fund pays a monthly distribution of $0.45 per share ($5.40 per share annually). This gives the fund’s shares a 12.35% yield at the current price, which as we have already seen is significantly higher than the fund’s peers. Unfortunately, the fund has not been especially consistent with its distribution over the years:
As I stated in the previous article on this fund:
We can see that the fund has made a few cuts over the years, notably in response to oil price collapses in 2015 and 2020. While these events did not impact the cash flows of most midstream companies, they did cause their share and unit prices to collapse. That resulted in losses for this fund. In addition, some midstream companies slashed their distributions in response to the market turning against their equity in order to reduce debt and become financially independent of the market. That reduced the fund’s income. As such, it makes sense that the fund would slash its own distribution since it needed to avoid destroying its net asset value too much.
Of course, the most important thing for our purposes today is to determine how well the fund can sustain its current distribution.
As of the time of writing, the most recent financial report for the NXG Cushing Midstream Energy Fund is the annual report that corresponds to the full-year period that ended on November 30, 2023. This is a newer report than the one that we had available to us the last time that we discussed this fund, so it will be useful to provide an update even though it will not include any information about the fund’s performance over the past few months.
For the full-year period that ended on November 30, 2023, the NXG Cushing Midstream Energy Fund received dividends and distributions totaling $6,056,720 along with $232,693 in interest from the assets in its portfolio. However, a significant portion of this money came from master limited partnerships and so is considered to be a return of capital and not investment income. As such, we need to subtract that money from the total and arrive at a total investment income of $2,622,986 for the period. This was not enough to cover the fund’s expenses, and it ended up with a net investment loss of $289,571 for the full-year period. This was nowhere close to enough to cover the $11,792,081 that the fund distributed to its shareholders over the same period.
The fund was, unfortunately, not able to make up the difference with capital gains. For the full-year period, it reported net realized gains totaling $1,738,467 along with $1,929,863 net unrealized gains. Overall, the fund’s net assets declined by $8,354,734 after accounting for all inflows and outflows during the period.
Thus, the fund failed to cover its distributions over the full-year period, which is quite worrying. However, it did manage to cover them over the trailing two-year period. On December 1, 2022, the fund had net assets of $80,882,596. This increased to $84,805,681 on November 30, 2023, despite the fact that the fund paid out distributions over the entire two-year period.
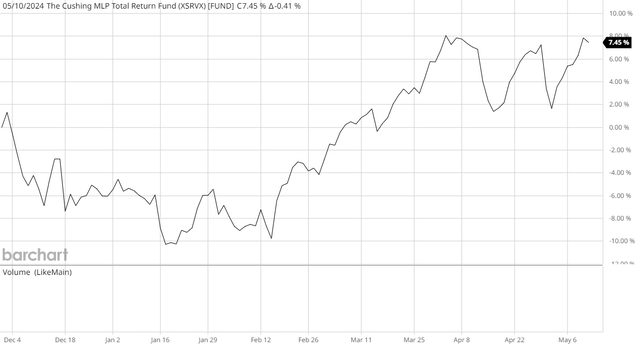
The fund also appears to have covered all of the distributions that it has paid out since the closing date of its financial documents. Here is the fund’s net asset value since November 30, 2023:
As we can see, the fund’s net asset value has increased by 7.45% since the close of the most recent fiscal year. This means that the fund has fully covered all of the distributions that it has paid out since that time, with money left over.
Overall, it does not appear that this fund is struggling to maintain its current distribution. However, we should still keep an eye on its net asset value.
Valuation
Shares of the NXG Cushing Midstream Energy Fund are currently trading at a 4.42% premium on net asset value. This is much more expensive than the 0.44% premium that the shares have had on average over the past month. Thus, shares of this fund are looking very pricey right now.
Conclusion
In conclusion, the NXG Cushing Midstream Energy Fund has been one of the star performers in the energy infrastructure space over the past few years. The fund’s yield is higher than all of its peers, and its performance has been very respectable. Perhaps surprisingly, the fund appears to be fully covering its distribution. It has encountered a few hiccups along the way, though, as it did technically fail to cover it in the most recent fiscal year. Overall, the only real problem here is the fund’s valuation, as it is currently trading at a price that is well above that of its assets and its monthly average.


