Yves here. This post usefully provides an analysis of the degree to which trade relations have changed as a result of Western sanctions and tariffs. It shows that patterns started shifting after 2018, as in a year after Trump implemented tariffs on China. Note that after the global financial crisis, there was a lot of hand-wringing among multinationals about the need to simplify supply chains and shift more production closer to final sales markets, but this post suggests not much actually happened.
The post is nevertheless timely because the Biden Administration is doubling down with China:
White House announces new anti-China tariffs:
🚗 Electric vehicles: from 25% to 100%
🔋 EVs batteries: from 7.5% to 25%
🌞 Solar cells: from 25% to 50%
🏭 Steel and aluminum: from 0%-7.5% to 25%#EnergyTransition #EVshttps://t.co/gSnLerBfz0— Javier Blas (@JavierBlas) May 14, 2024
One thing about this post is the remarkable lack of agency, starting with the first sentence: “There has been a rise in trade restrictions…” Another striking feature is the use of MBA-evocative intended-to-become buzzwords like “slowbalification” and sadly established ones like “friend-shoring” and “de-risking.” “De-risking” is particularly obfuscatory. How does the EU dropping cheap Russian gas reduce risk….unless you admit those dastardly Rooskies had no reason to blow up their own pipeline and have Europe shift to high price LNG, which increases economic risk by increasing costs. The piece kinda-sorta acknowledges that business margins are taking hits, but not the severe damage of slow motion European de-industrialization. However, in a highly coded manner, it suggests that former exports may still be getting there via other routed.
So I am left wondering if this sort of soft self-censorship has become endemic, at least among European economists whose areas of expertise impinge on the new Cold War.
By Costanza Bosone, PhD candidate University Of Pavia; PhD candidate University School Of Advanced Studies (IUSS) – Pavia; ;Ernest Dautović, Supervisor European Central Bank; Michael Fidora, Senior Lead Economist European Central Bank; and Giovanni Stamato, Consultant European Central Bank. Originally published at VoxEU
There has been a rise in trade restrictions since the US-China tariff war and Russia’s invasion of Ukraine. This column explores the impact of geopolitical tensions on trade flows over the last decade. Geopolitical factors have affected global trade only after 2018, mostly driven by deteriorating geopolitical relations between the US and China. Trade between geopolitically aligned countries, or friend-shoring, has increased since 2018, while trade between rivals has decreased. There is little evidence of near-shoring. Global trade is no longer guided by profit-oriented strategies alone – geopolitical alignment is now a force.
Since the global financial crisis, trade has been growing more slowly than GDP, ushering in an era of ‘slowbalisation’ (Antràs 2021). As suggested by Baldwin (2022) and Goldberg and Reed (2023), among others, such a slowdown could be read as a natural development in global trade following its earlier fast growth. Yet, a surge in trade restriction measures has been evident since the tariff war between the US and China (see Fajgelbaum and Khandelwal 2022) and geopolitical concerns have been heightened in the wake of Russia’s invasion of Ukraine, with growing debate about the need for protectionism, near-shoring, or friend-shoring.
The Impact of Geopolitical Distance on International Trade
Rising trade tensions amid heightened uncertainty have sparked a growing literature on the implications of fragmentation of trade across geopolitical lines (Aiyar et al. 2023, Attinasi et al. 2023, Campos et al. 2023, Goes and Bekker 2022).
In Bosone et al. (2024), we present new evidence and quantify the timing and impact of geopolitical tensions in shaping trade flows over the last decade. To do so, we use the latest developments in trade gravity models. We find that geopolitics starts to significantly affect global trade only after 2018, which, timewise, is in line with the tariff war between the US and China, followed by the Russian invasion of Ukraine. Furthermore, the analysis sheds light on the heterogeneity of the effect of geopolitical distance by groups of countries: we find compelling evidence of friend-shoring, while our estimates do not reveal the presence of near-shoring. Finally, we show that geopolitical considerations are shaping European Union trade, with a particular focus on strategic goods.
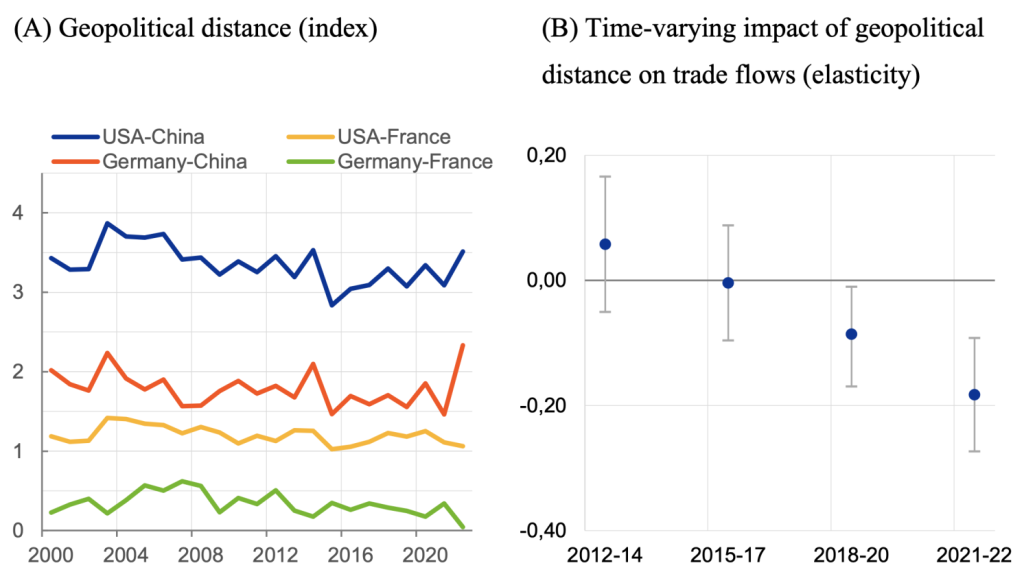
In this study, geopolitics is proxied by the geopolitical distance between country pairs (Bailey et al. 2017). As an illustration, Figure 1 (Panel A) plots the evolution over time of the geopolitical distance between four country pairs: US-China, US-France, Germany-China, and Germany-France. This chart shows a consistently higher distance from China for both the US and Germany, as well as a further increase in that distance over recent years.
Geopolitical distance is then included in a standard gravity model with a full set of fixed effects, which allow us to control for unobservable factors affecting trade. We also control for international border effects and bilateral time-varying trade cost variables, such as tariffs and a trade agreement indicator. This approach minimises the possibility that the index of geopolitical distance captures the role of other factors that could drive trade flows. We then estimate a set of time-varying elasticities of trade flows with respect to geopolitical distance to track the evolution of the role of geopolitics from 2012 to 2022. To the best of our knowledge, we cover the latest horizon on similar studies on geopolitical tensions and trade. To rule out the potential bias deriving from the use of energy flows as political leverage by opposing countries, we use manufacturing goods excluding energy as the dependent variable. We present our results based on three-year averages of data.
Figure 1 Evolution of geopolitical distance between selected country pairs and its estimated impact on bilateral trade flows

Notes: Panel A: geopolitical distance is based on the ideal point distance proposed by Bailey et al. (2017), which measures countries’ disagreements in their voting behaviour in the UN General Assembly. Higher values mean higher geopolitical distance. Panel B: Dots are the coefficient of geopolitical distance, represented by the logarithm of the ideal point distance interacted with a time dummy, using 3-year averages of data and based on a gravity model estimated for 67 countries from 2012 to 2022. Whiskers represent 95% confidence bands. The dependent variable is nominal trade in manufacturing goods, excluding energy. Estimation performed using the PPML estimator. The estimation accounts for bilateral time-varying controls, exporter/importer-year fixed effects, and pair fixed effects.
Sources: TDM, IMF, Bailey et al. (2017), Egger and Larch (2008), WITS, Eurostat, and ECB calculations.
Our estimates reveal that geopolitical distance became a significant driver of trade flows only since 2018, and its impact has steadily increased over time (Figure 1, Panel B). The fall in the elasticity of geopolitical distance is mostly driven by deteriorating geopolitical relations, most notably between the US and China and more generally between the West and the East. These reflect the effect of increased trade restrictions in key strategic sectors associated to the COVID-19 pandemic crisis, economic sanctions imposed to Russia, and the rise of import substituting industrial policies.
The impact of geopolitical distance is also economically significant: a 10% increase in geopolitical distance (like the observed increase in the USA-China distance since 2018, in Figure 1) is found to decrease bilateral trade flows by about 2%. In Bosone and Stamato (forthcoming), we show that these results are robust to several specifications and to an instrumental variable approach.
Friend-Shoring or Near-Shoring?
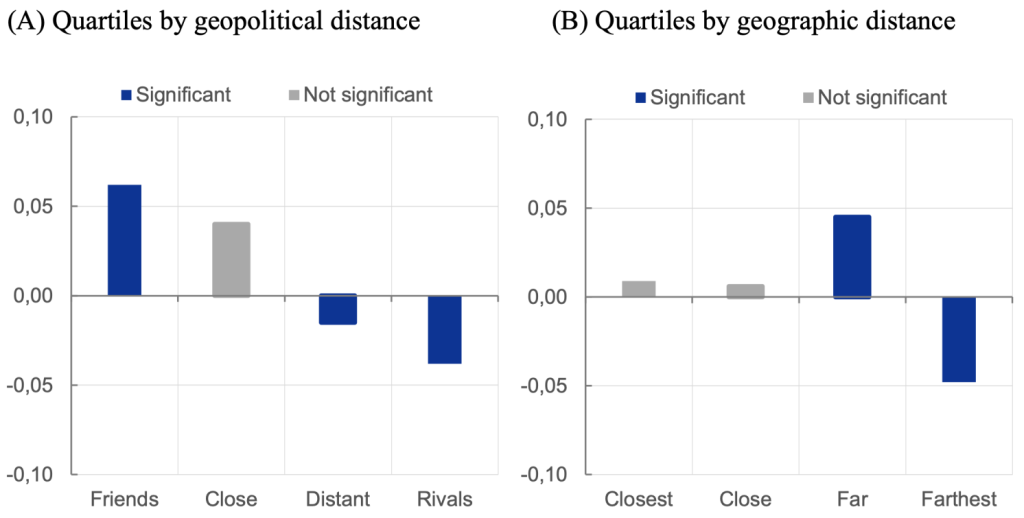
Recent narratives surrounding trade and economic interdependence increasingly argue for localisation of supply chains through near-shoring and strengthening production networks with like-minded countries through friend-shoring (Yellen 2022). To offer quantitative evidence on these trends, we first regress bilateral trade flows on a set of four dummy variables that identify the four quartiles of the distribution of geopolitical distance across country pairs. To capture the effect of growing geopolitical tensions on trade, each dummy is equal to 1 for trade within the same quartile from 2018 and zero otherwise.
We find compelling evidence of friend-shoring. Trade between geopolitically aligned countries increased by 6% since 2018 compared to the 2012–2017 period. Meanwhile, trade between rivals decreased by 4% (Figure 2, Panel A). In contrast, our estimates do not reveal the presence of near-shoring trends (Figure 2, Panel B). Instead, we find a significant increase in trade between far-country pairs, offset by a relatively similar decline in trade between the farthest-country pairs. Overall, shifts toward geographically close partners are less pronounced than toward geopolitically aligned partners.
Figure 2 Impact of trading within groups since 2018 (semi-elasticities)

Notes: Estimates in both panels are obtained by PPML on the sample period 2012–2022 using consecutive years. Please refer to Figure 1 for details on estimation. The effects on each group are identified based on a dummy for quartiles of the distribution of geopolitical distance (panel A) and on a dummy for quartiles of the distribution of geographic distance (panel B) across country pairs. The dummy becomes 1 in case of trade between country pairs belonging to the same quartile since 2018. A semi-elasticity corresponds to a percentage change of 100*(exp()-1).
Sources: TDM, IMF, Bailey et al. (2017), Egger and Larch (2008), WITS, Eurostat, CEPII, and ECB calculations.
Evidence of De-Risking in EU Trade
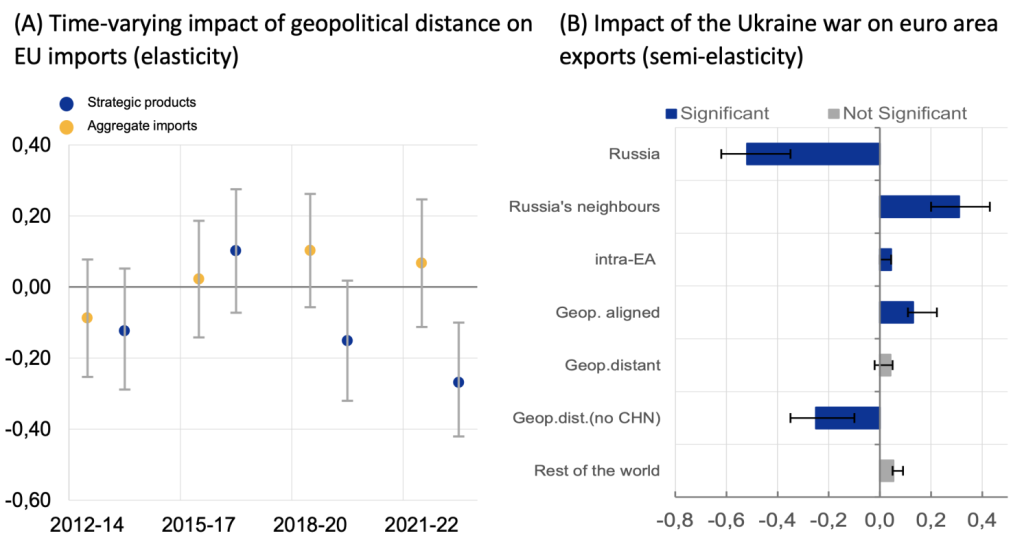
The trade impact of geopolitical distance on the EU is isolated by interacting geopolitical distance with a dummy for EU imports. We find that EU aggregate imports are not significantly affected by geopolitical considerations (Figure 3, Panel A). This result is robust to alternative specifications and may reflect the EU’s high degree of global supply chain integration, the fact that production structures are highly inflexible to changes in prices, at least in the short term, and that such rigidities increase when countries are deeply integrated into global supply chains (Bayoumi et al. 2019). Nonetheless, we find evidence of de-risking in strategic sectors. 1 When we use trade in strategic products as the dependent variable, we find that geopolitical distance significantly reduces EU imports (Figure 3, Panel A).
Figure 3 Impact of geopolitical distance on EU imports and of the Ukraine war on euro area exports

Notes: Estimates in both panels are obtained by PPML on the sample period 2012–2022. Panel A: Dots represent the coefficient of geopolitical distance interacted with a time dummy and with a dummy for EU imports, using 3-year averages of data. Lines represent 95% confidence bands. Panel B: The sample includes quarterly data over 2012–2022 for 67 exporters and 118 importers. Effects on the level of euro area exports are identified by a dummy variable for dates after Russia’s invasion of Ukraine. Trading partners are Russia; Russia’s neighbours Armenia, Kazakhstan, the Kyrgyz Republic, and Georgia; geopolitical friends, distant, and neutral countries are respectively those countries that voted against or in favour of Russia or abstained on both fundamental UN resolutions on 7 April and 11 October 2022. The whiskers represent minimum and maximum coefficients estimated across several robustness checks.
Sources: TDM, IMF, Bailey et al. (2017), Egger and Larch (2008), WITS, Eurostat, European Commission, and ECB calculations.
We conduct an event analysis to explore the implications of Russia’s invasion of Ukraine on euro area exports. We find that the war has reduced euro area exports to Russia by more than half (Figure 3, Panel B), but trade flows to Russia’s neighbours have picked up, possibly due to a reordering of the supply chain. Euro area exports with geopolitically aligned countries are estimated to have been about 13% higher following the war, compared with the counterfactual scenario of no war. We find no signs of euro area trade reorientation away from China, possibly reflecting China’s market power in key industries. However, when China is excluded from the geopolitically distant countries, the impact of Russia’s invasion of Ukraine on euro area exports becomes strongly significant and negative.
Concluding Remarks
Our findings point to a redistribution of global trade flows driven by geopolitical forces, reflected in the increasing importance of geopolitical distance as a barrier to trade. In this column we review recent findings on geopolitics in trade and their impact since 2018, the emergence of friend-shoring rather than near-shoring, and the interactions of strategic sectors with geopolitics in Europe. In sum, we bring evidence of new forces that now drive global trade – forces that are no longer guided by profit-oriented strategies alone but also by geopolitical alignment.
_______


