Yves here. As we’ve mentioned occasionally, storied short seller David Einhorn would often warn his team: “No matter how bad you think it is, it’s worse.” Here, even though most readers accept the proposition that big donors call the shots in Congress, this post shows how the concentration of money is even more extreme than many might have assumed. And separately, it’s useful to prove suspicions, here with Mitch McConnell as the focus of study.
By Matthias Lalisse, Department of Linguistics and Cognitive Science, Johns Hopkins University. Originally published at the Institute for New Economic Thinking website
hen, on February 28 of this year, Sen. Mitch McConnell announced that he would not stand again for the post of Republican leader in the Senate, most media and political commentators recognized that out of the ordinary was happening; most treated the decision as the end of an era.
This it certainly is, and more than one essay could be devoted to tracing out its implications. But lost in the torrent of media reflections and McConnell’s musings about being “the only Reagan Republican left” is the most important fact of all about his tenure: his status as a peerless practitioner of the dark art of money-driven politics, which served as the indispensable foundation for his hold on the Senate machinery. Especially because we are now hearing so much about how affluent Americans are said to be tilting so strongly toward Democrats in recent decades,(1) McConnell’s record in vacuuming up political finance merits more than a moment’s notice.
The fundamental reality can be summarized very simply: His political base rested uniquely on a gigantic, never-ending flow of money from big donors. The size profile of his donations is stunningly one-dimensional. No Trump-like barbell of big and small donors or, a fortiori, Bernie Sanders’ or AOC’s mountains of small contributions: Just endless flows of mega-bucks from the heaviest of heavy hitters.
The pattern has been obvious to all but political scientists and most journalists for years: Earlier work by Ferguson, Jorgensen & Chen (2016, 2022) profiled the congressional brass and leading presidential candidates of 2016 in terms of the sizes of the total contributions they received.(2)
Figure 2: Contributions to congressional leaders & leading presidential candidates by size after Ferguson, Jorgensen, and Chen, 2022.
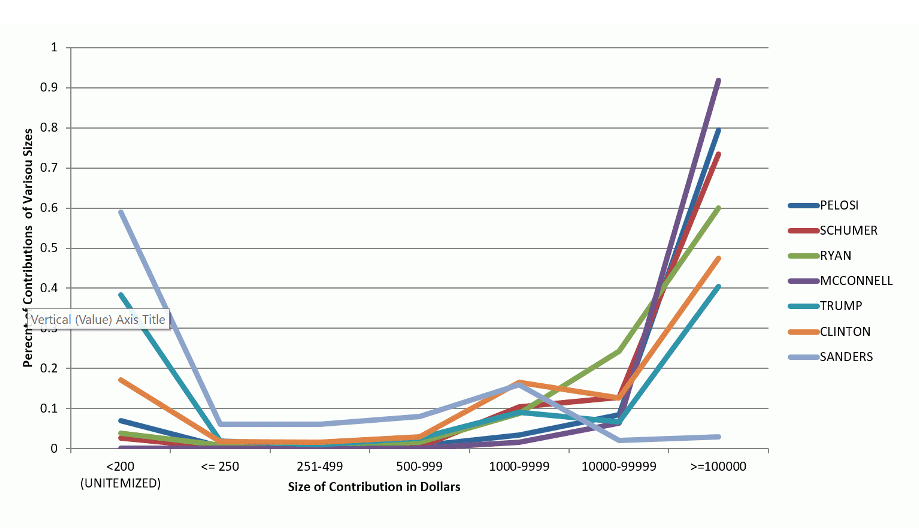
Mega donors predominate on all but one of these lists. Small donors barely register for the House/Senate leaders, where they never break 10% of receipts. Small donors could cease to exist, and the House and Senate chiefs of both parties could continue contentedly filling their various PACs and Super PACs and deploying them not only to secure their own re-election but to aid their preferred crops of newcomers and wield the influence of the purse over those on the bench.
Presidential elections, of course, animate the broad public to a greater extent than congressional business, yet even here, with the remarkable exception of Bernie Sanders, contributions from megadonors (i.e., greater than or equal to $100,000) exceed those from small donors for each presidential hopeful. Those seeking an explanation of the well-known Gilens and Page result (2014)—that the preferences of economic elites not “median voters” predict most policy outcomes—might almost conclude their quest with this simple fact.(3)
Yet in 2016 McConnell stands out even in this rarefied company. Nor did anything essential change in subsequent election cycles as a look at his record since then easily shows.
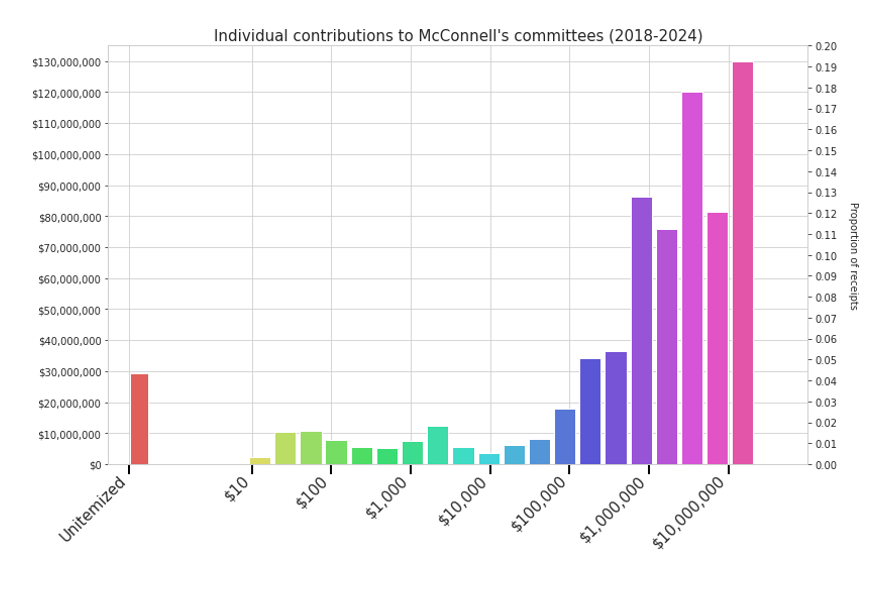
We start with an overview of all donors, including PACs and organizations, as an ensemble. Then we break out data for individuals only. Given McConnell’s own advocacy of the Orwellian principle that corporations are people and money is speech, it is only fair to include the (large) organizational donors, which supply about $290 million (30%) of McConnell’s receipts. Focusing only on genuine individuals (Figure 4) does not materially change the picture.
Figure 3 summarizes contributions from individuals, including the candidate himself, as well as nonaffiliated PACs, and those from organizational donors not registered as political committees. The latter category ranges from conservative “dark money” shell organizations like One Nation (whose CEO is a former McConnell chief of staff; $115 million to McConnell during the period covered by the chart) that mask a sea of megadonors behind the legal form of a non-profit, to contributions without intermediary from big oil (e.g. Chevron, Koch Industries, the American Petroleum Institute, etc.; $40 million to McConnell). Small contributions—those from donors who contributed less than $200 per election cycle—are crammed into the red bar on the left.(4)
Figure 3: Contributions to Mitch McConnell’s committees split by transaction size (log-scaled). Proportion of total receipts displayed on the right-hand axis.
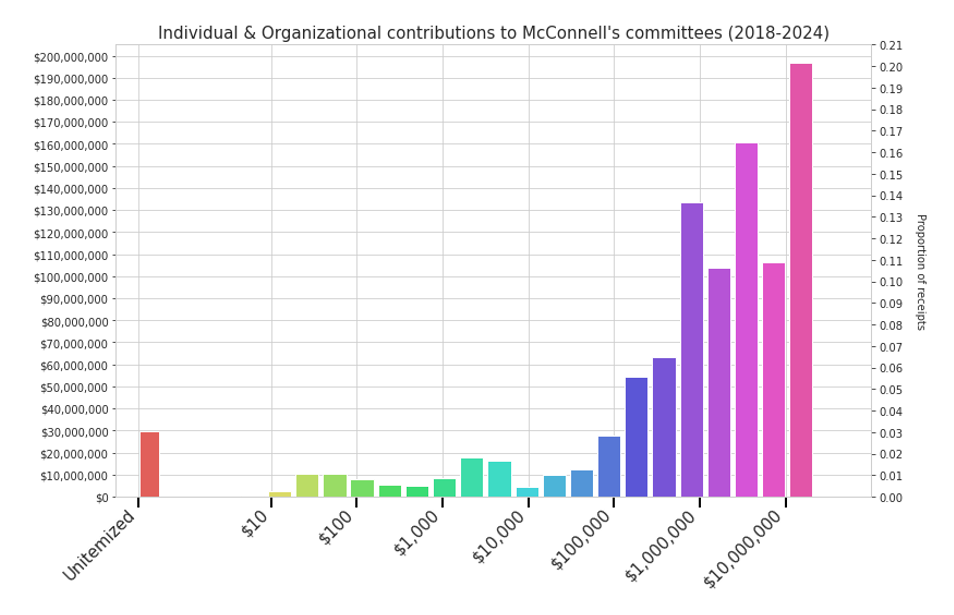
The essential point is that small contributions (the unitemized total of donations too small to require recording on the far left of the graph’s bottom axis) again barely register. In stark contrast, summing together all contributions larger than or equal to $100,000, we find that 85.3% of McConnell’s money comes from the King Kongs and Godzillas of political investors.
It is true that donors of this scale exist for both parties, and their interests differ along axes that have been explored elsewhere (e.g., Ferguson 1995). McConnell’s piece of this pie shows obvious concentrations in oil and gas, service industries, military contractors, realtors, and a collection of conservatively branded ideological groups that often turn out to be shells for political operations by other prominent Republicans.(5)
Perhaps a look at contributions just from bona fide individuals might change the impression of the dominance of big money? The answer is no. (Figure 4) When we include organizations, small (unitemized) donors make up 3% of McConnell’s receipts. When organizations are eliminated, they make up 4%. No matter how you slice it, McConnell’s constituency is not Kentucky, but the ultra-rich.(6)
Figure 4: Contributions to Mitch McConnell’s committees, excluding Organizations and PACs. Proportion of total receipts displayed on the right-hand axis
The Revolving Door Revolves Again
A political leader capable of commanding resources on this scale over a long period of time of course will wield immense influence in many quarters. A particularly striking example that has garnered increasing attention is how Congressional staff and their principles jointly profit from so-called “revolving doors” (Blanes i Vidal et. al. 2012).(7)
Even here, of course, we see through a glass darkly. Federal laws governing lobbying disclosure are rather opaque. New York State law, for instance, requires lobbyists to declare not just that they are lobbying, but who they are lobbying, with any attempt to influence a state-level official traced in their routine reports. By contrast, the federal Lobby Disclosure Act requires lobbying activities to be reported only in very broad strokes: the client, the policy issue, and the amount billed, but also, crucially, any positions the lobbyist has held in the federal government, including connections to legislators.
Unsurprisingly, such connections are greatly prized. Prior work by Vidal, Draca, and Fons-Rosen (2012)(8) has shown an “immediate and discontinuous” drop in revenue for lobbyists whose patron Senators exit office, a rather vivid example of the adage about it being “who you know, not what you know” that determines the size of the paycheck. Such empirical effects are not mysterious: in the group as a whole most must be trading in access.
Using machine learning techniques, we have extracted the Senatorial revolving-door network for 2016-2024. It is visualized below in a static form for the current Senate. (We hope to post an interactive version later, which would allow users to explore the precise connections between members of the current Senate and lobbyists working for Washington’s 150 top-billing lobby clients.)(9)
Figure 5: The revolving door network, 118th Senate
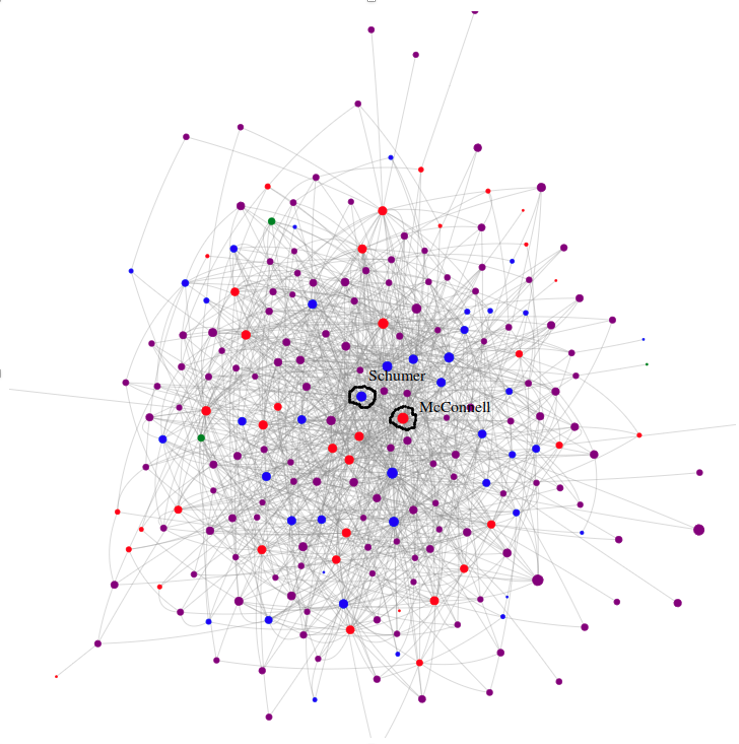
The interactive version can be probed for various interesting details. But the most important conclusion is once again obvious: the leaders of both major parties in the Senate sit centrally within this dense network of firms whose employees (lobbyists) have privileged access to their legislative offices. Both Schumer and McConnell have comparable numbers of links to firms actively lobbying the federal government (521 and 591, respectively). A detailed analysis of the relative proportions in which specific firms and industries invest in influence is not something we can present here, but it is obvious that differences across party lines are mostly subtle, even in industries like oil and gas, finance, or internet technology to which polemic and polling frequently impute a definite political tilt.
In other words, the world of Congressional lobbying is less red or blue than “purple.” with both Schumer and McConnell sharing links to such centerpieces of national industry as Boeing, Pfizer, Exxon Mobil, and Amazon. In terms of the gross number of links to the K-street clientele, there is no noticeable partisan difference, Of the 48 Democratic Senators in office,(10) 45 (93.8%) have links to lobbyists. Of the 49 Republicans, 44 (89.8%) are so linked.(11)
But there is tremendous variation in both the number of links, and their monetary value, with associates of the congressional leadership enjoying by far the most extensive networks now embedded in industry after a stint in “public service”. In terms of the raw number of links, McConnell is only exceeded by another long-serving Senate officer, Patty Murray (D-WA), the president pro-tempore, known to constituents for her cozy relationship with lobbyists. But her list of associations though, deep-pocketed as it is, does not represent the largest pot of money. The GOP leader easily retains that crown, with McConnell-linked organizations spending $8.4 billion on lobbying to Murray’s $7.6 billion.(12)
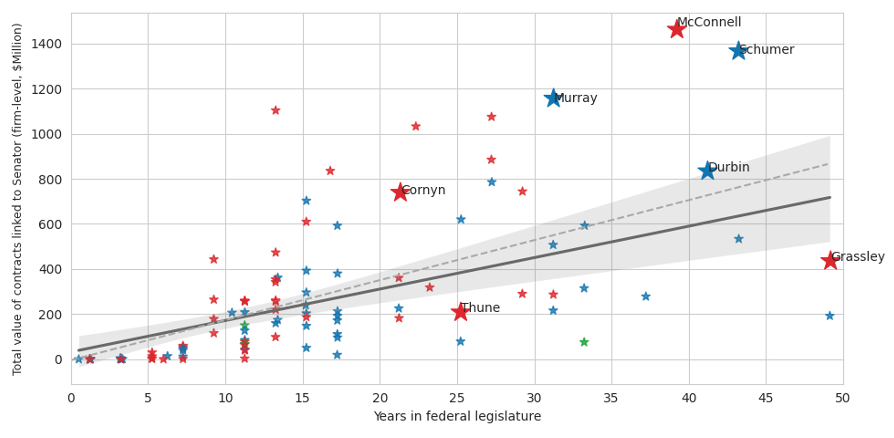
This effect is not simply an artifact of longevity, as the reference to Murray might suggest. To drive this point home, we have plotted the current Senate by the amount of time in office against the totals of money-in to teams of lobbyists linked to each Senator.(13) This calculation again shows McConnell on top, with Schumer close behind. Membership in Senate leadership seems to be a factor, with associates of the two top party leaders absorbing uniquely large shares of lobbying expenditure relative to the others. As the error bounds in the graph show, however, other factors are evidently at work.(14)
Figure 6: Value of all contracts to teams of lobbyists linked the 118th Senate, by Senator’s years in the federal legislature.
Why these results matter should be obvious. Who writes the bills in Congress? Many instances have been identified of text exclusively or partially generated by lobbyists, or in close consultation with them. Federal legislators are generally not so careless as to pass off as their own the sorts of “copycat bills” that have taken over state legislatures. As a recent example of how things tend to go, Senator Joe Manchin’s side deal on oil permitting, for which sake the Senator threatened to tank the Inflation Reduction Act, went round and round in iterations circulated among lobbyists for comment, including a draft stamped with the American Petroleum Institute’s house watermark. In a move typical of the culture, Manchin’s chief of staff quickly went on to join API as a top lobbyist.
Beyond the case studies, it can be useful to think in aggregates. The lobbyists in our dataset frequently report titles like “Policy Advisor”, “Policy Director”, “Legislative Assistant”, or “Legislative Counsel” to their respective legislators. The Congress’s brain trust—those who write the bills when it’s not the lobbyists—have been siphoned away by industry to a shocking extent, now paid to solve intricate problem sets in the optimal design of loose regulation and evadable taxes, in addition to the premium for their priority on the phone. It is also good to remember the causal flow in the other direction: legislators with tight industry connections can open up a new pool of campaign donors, and the opportunity themselves to step through the revolving door. With all the strings, of course, that come with initiating such barters.(15)
In a political system whose primary currency is not the vote but the dollar, McConnell’s role as leader has plainly been well-earned. And in this context, it is easy to understand why he played a key role in milestone court decisions that made corporate money in politics ever easier. For example, the first significant sortie in the Supreme Court on the questions ruled on in Citizens United bears McConnell’s name. A historically prodigious fundraiser, McConnell leveraged an extensive network of industry contacts to raise hundreds of millions of dollars every cycle—principally through Super PAC/dark money organizations operated by his former close associates. The result: Republican cohorts supplementing to good effect the Senate’s statutory advantages to the numerical minority (apportionment to states; the filibuster) with the right’s eternal competitive advantage: the loot of inequality.
It will be interesting to see if McConnell’s probable replacements can match his record. Rick Scott, who famously propelled his Senate candidacy in 2018 with $64 million dollars of his own money, is a familiar face to big business as the principal rainmaker for the GOP’s Senate campaign arm, the NRSC. John Cornyn and John Thune, both lifelong political operatives and the latter an ex-lobbyist, are easy to find in our revolving door network, with Cornyn’s lobby count rivaling McConnell’s own (410).
For all of these, and, indeed, for congressional leaders of both parties, small contributions, are the exception rather than the rule.
The exceptions, though, are significant. Ferguson et. al. 2022 observed that the Sanders campaign was a historical anomaly indicating that “two souls are now at war in the Democratic Party: Large groups of aroused small donors versus what can be termed a Democratic establishment dependent on big money from the 1%.” No such clash of cultures shows in the Senate Republican leader’s history.
___________
The author is grateful to Thomas Ferguson and Paul Jorgensen for very helpful comments.
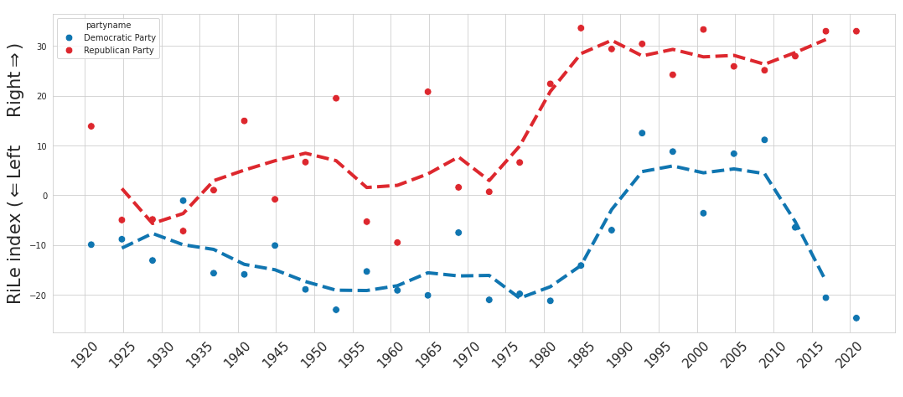
(1) See, e.g., (Zacher 2023) or (Gethin, Martínez-Toledano and Piketty 2022), each arguing based on demographic studies of national and presidential elections that affluent voters are increasingly tilting towards parties representing the left. One fundamental point regarding this discourse is warranted here: it is important not to assume the consequent (that voters are changing) by ignoring the main basis of voter affiliation, namely party programs. These are hard to assess simply, but one suggestive first approximation comes from studies of party platforms. Parties change, too, and drastically. In the United States, we might concretely point to the abrupt erosion of the New Deal consensus that anchored Democratic politics until the 1980s, depicted in Figure 1.5 using data on party platform alignment (Left-Right) from the Comparative Manifesto Project. No simple story about voter repolarization due to education or cultural evolution will do unless it takes into account that certain economic options (like taxing the rich) were largely taken off the menu. Even seemingly independent measures of voters’ ideological alignment can be tainted by dynamics on the “supply side” of the equation; for just as the cave-dweller does not know it is possible to own a car, the voter may not know they can have an efficiently operated national health insurance unless that horizon of possibility is well and frequently articulated by visible members of the political elite. This, of course, returns us to questions of the horse and the cart: party platforms are largely driven by factors largely independent of the voter, as the investor-theory of party competition holds (Ferguson 1995).
Figure 1.5: Left/Right policy alignment (Rile Index, Laver & Budge, 1992) for the Democrat and Republican parties 1920-2020.
(2) Their paper aggregated donations from repeat contributors to summarize the distribution; the suggestion is not that all contributions came in slices that big. The Obama campaign and many others, as the paper notes, did precisely the same in other election cycles. See Thomas Ferguson, Paul Jorgensen, and Jie Chen, “How Money Drives US Congressional Elections: Linear Models of Money and Outcomes,” Structural Change and Economic Dynamics Vol 61 (2022), pp. 527-45. https://doi.org/10.1016/j.strueco.2019.09.005
(3) See however the reanalyses of their data by Maguire and Delahunt (2020) and the discussion by Ferguson 2020.
(4) Our tabulations for the election cycles since 2016 differ from the methods used in Ferguson, Jorgensen, and Chen 2012 and 2022. Those summarize total contributions by donors. By contrast, this discussion uses the size of the contributions, not summed by contributor to avoid the problem of record linkages across election cycles. In other words, we have confined our attention to the size of the donor’s check. Since aggregating multiple contributions from the same donor virtually always reallocates contributions upwards, our graph underestimates the tilt towards large donors. By how much? Sheldon Adelson’s largest individual check to McConnell was $12,500,000, but he contributed similar amounts multiple times, with a sum of about $60 million, or $132 million when we include the virtually identical profile of contributions from his wife. So the differences can often be an order of magnitude or more.
Contributions are put on a log scale. To generate the figures, we used the following procedure: contributions were transformed to log10 space and then segmented into 25 bins of equal width in log space, with the contents of each bin summed to obtain the bar height. Numbers reported in the main text were computed directly by filtering the array of itemized contributions by size (>= $100,000), and then dividing the sum of these by the total sum of itemized and unitemized contributions.
As with (Ferguson, Jorgensen and Chen 2022), we use the FEC’s ITOTH files for itemized individual contributions (https://www.fec.gov/data/browse-data/?tab=bulk-data). PAC-to-PAC transfers, including 15E transactions, are fetched from the ITCONT files, with transactions from recipient-side filings (18K) deduplicated with contributions disclosed by the donor (24K). Our inventory of McConnell-affiliated PACs includes 14 PACs: his principal campaign committee, his leadership PAC (Bluegrass Committee, FECID=C00235655) and Super PAC (Senate Leadership Fund, C00571703), five single-member joint fundraisers (C00535161, C00536409, C00548651, C00638007), five multi-member joint fundraisers (C00540880, C00802876, C00651364, C00567438, C00652081), and one PAC affiliated with the Bluegrass Committee (Making Investments Towards Conservative Heroes PAC, C00760348). With respect to the multi-member joint fundraisers, we calculated contributions taking into account the number of members. Specifically, for each cycle the PAC was active, we looked up from filings the number of candidates affiliated with the PAC in that cycle, and then divided each contribution by that number, assuming McConnell receives an equal share. Small contributions were retrieved from the INDV_UNITEM_CONT field of the FEC’s COMMITTEE_SUMMARY files, available here. The FEC processes and uploads data for the current election cycle on a rolling basis and our data from 2024 are based on a download of bulk data from the FEC on February 25th, 2024, which has data for most committees up to Q4 of 2023.
(5) Among McConnell’s top donors, we discover the “Opportunity Matters Fund” ($5,475,000), a Tim Scott Super PAC, and the “Freedom Fund” ($655,000), Mike Crapo’s leadership PAC, alongside groups like the “Conservative Americans PAC” ($1,500,000) and “American Liberty Action PAC” ($1,250,000) that are essentially fronts for dark money groups.
(6) Crucially, not the ultra-rich of Kentucky, either. At most 4.1% of McConnell’s contributions come from donors in the Bluegrass State. We say “at most” because we do not have geographic information for small donors, so we obtain this upper bound by assuming all small donor contributions emanate from KY. Only 1% of itemized contributions hail from there, so this is prima facie a substantial overshoot.
(7) See also their empirical work on shadow lobbying in d’Este, Draca & Fons-Rosen 2020.
(8) Blanes i Vidal, Jordi, Mirko Draca, and Christian Fons-Rosen. 2012. “Revolving Door Lobbyists.” American Economic Review, 102 (7): 3731-48.
(9) For the purpose of the visualization, we only include the top 150 lobbying clients (measured by their spending on lobbying in 2016-2024) as nodes in the network, though the text displayed when hovering the cursor over a legislator node includes the full set of organizations lobbied for—sorted by the amount they spent.
The lobby network and associated spending estimates are derived as follows: We use natural language processing (NLP) to merge names of lobbying clients into normalized firm names using a battery of heuristics built specially to process patterns common in LDA filings. For example, a lobbying firm X & Y ASSOCIATES. might report a contract with CHEVRON using any of the names “CHEVRON”, “CHEVRON CORP.”, “CHEVRON CORPORATION”, “X & Y ASSOC. O.B.O. CHEVRON” or “X & Y ASSOCIATES ON BEHALF OF CHEVRON CORP.” to identify the client. Our algorithm recursively normalizes each of these instances to “CHEVRON”. The legislator links are likewise extracted from the filings’ ‘covered_positions’ entry using custom-built NLP systems, with legislator links included only if they match to a unique member of the congress (including both House and Senate) who held office after 2011. The ‘lobbylinks’ system is indebted to the excellent ‘congress-legislators’ database (https://github.com/unitedstates/congress-legislators), an open-source initiative maintained by ProPublica, GovTrack, and a number of other institutions, which provides detailed metadata for congresses past and present. Regarding our contract value estimates for each reported lobbying activity, we refer only to quarterly filings (Q1-4), using the lobby firm’s ‘income’ field for clients employing a third-party lobbying firm, and the ‘expenses’ field for organizations employing in-house lobbyists.
(10) Omitted from this calculation are the three Independents: Bernie Sanders, Kyrsten Sinema, and Angus King.
(11) A study by Furnas et. al. (2019) suggests that partisan tilt in lobbying firms is essentially bimodal with concentration at the extremes, with a smaller third mode towards the center with a minority of firms making political contributions that are evenly split between Democrats and Republicans. This leaves open the question, though, about how this distribution shakes out at the level of the client (with many clients purchasing the services of multiple lobbying firms, thereby spreading their activities across partisan specialists), and in the in-house lobbying sector, which is numerically larger in terms of spending. See esp. Fig. 1 in Furnas et al. 2019.
(12) Among currently serving federal officials, the following are the top-ranked by amount spent on lobbying by connected organizations: Mitch McConnell ($8.47 billion), Steve Scalise ($7.78 billion), Patty Murray ($7.63 billion), Roy Blunt (ex. 2023, $7.19 billion), Nancy Pelosi ($7.18 billion), Chuck Schumer ($5.54 billion), John Cornyn ($5.28 billion), Maria Cantwell ($5.13 billion), Xavier Becerra ($5.13 billion), Kevin McCarthy (ex. 2024, $5.13 billion), Pat Toomey (ex. 2023, $5.07 billion), and Dick Durbin ($4.66 billion).
(13) This graph is based on a somewhat more refined calculation of expenditure linked to each Senator. As a technical note, remuneration to individual lobbyists is not reported under the LDA—another place where reporting requirements could be stricter. Instead, money changing hands in the course of lobbying is reported at the level of the lobbying firm, identifying for each contract its client, value (quarterly), and the lobbyists involved. Therefore, we approach the estimates somewhat indirectly by grouping together a firm’s contracts with the same client and identifying those contracts whose team of lobbyists is linked to the Senate. Our reported numbers are assuredly underestimates. Work by d’Este, Draca, and Fons-Rosen (2020) measures the economic effects of unregistered “shadow lobbyists” who. because of spending less than 20% of their time on lobbying activities, are not obliged to register under the LDA. Thus, under the so-called Daschle rule, an ex-congressperson or congressional staffer paid for “policy expertise” might spend every Monday on the phone clinching meetings for her or his firm’s associates without registering as a member of the profession.
(14) The regression against time in office is depicted for two samples: the 118th Senate with the leaders and minus them along with statistical bounds on the estimate for the latter. The two samples do not differ. More formally, we conducted a regression with the specification INTERCEPT + YEARS_IN_OFFICE + IS_LEADER + YEARS_IN_OFFICE*IS_LEADER. YEARS_IN_OFFICE is significant at p<.001, with the main effect of IS_LEADER and the interaction nonsignificant (p=.25,.84 respectively). In this test, we defined the chamber leaders broadly to include the Whips and the President pro-tempore. Specifically, we ran the same regression on the 94 Senators obtained after removing Schumer (Democratic Leader 2017-Present), Durbin (Democratic Whip 2005-Present), McConnell (Republican Leader 2007-Present), Cornyn (Republican Whip 2013-2019), Thune (Republican Whip 2019-Present), and the Presidents pro-tempore of the Senate (Grassley, 2021-2022) and Murray (2023-Present). The results do not qualitatively differ when Murray and Grassley are excluded: p(coef(IS_LEADER)>0)=.39, p(coef(IS_LEADER*YEARS_IN_OFFICE)>0)=.066.
(15) This legislative brain drain is a relatively recent product of reforms undertaken under Gingrich in the 90s, where the number of policy staffers allocated to congressional committees was severely cut in a move that Glastris and Sweetland Edwards rather aptly refer to as the 1995 “Big Lobotomy”, with smaller excisions of Congress’s policy brainsince. The effect: a reallocation of policy expertise from the electorally accountable and relatively disinterested public sector over to the highly self-interested private sector, while also centralizing power to the Speaker’s office, since the committees were in a weakened position to generate independent proposals. These steps coincided with deliberate efforts by the leadership of both parties to attract more political money. See the discussion in Ferguson 2015.
See original post for references

