bhofack2/iStock via Getty Images
Corporate Overview
Bloomin’ Brands (NASDAQ:BLMN) is a company that has operated and franchised restaurants in various segments for 36 years. Bloomin’ Brands works with different restaurant concepts and different segments. That is, although the company is known for operating brands that stand out in the casual dining segment, it has brands that intersect fine dining and fast casual. Currently, most of the restaurants under Bloomin’ are directly controlled by the company. That is, around 80% of its units are operated by Bloomin’, while 20% of them are franchises.
As we will see in more detail when I dissect Bloomin’ operations, the company operates in two distinct operating segments, but not all of its brands cover each operating segment. In the United States segment, which accounts for 86% of the company’s revenue, all brands are covered. Meanwhile, in the International segment, Bloomin’ only expanded the Outback Steakhouse and Carrabba’s Italian Grill brands (only in Brazil, better known as Abbraccio).
Let’s remember what the concepts of each brand are and the functions of each one in Bloomin’ value proposition? Initially I would like to remind you what a concept is when we talk about restaurants. A concept is an amalgam of signs that make up the definition of an establishment. These signs range from the type of cuisine, service, decoration, philosophy, etc. In a marketing scope, we can infer that a well-defined concept helps a restaurant in several ways.
We can say that a well-defined concept would help a restaurant to segment its customers without the counterpart of a considerable amount of capital invested in advertising. A well-defined concept builds customer loyalty and creates added value to the experience in trial products, serving as a platform for differentiation actions and quality cues. In other words, it is the basis of everything when it comes to restaurants. I often say that a well-defined concept is not more important than a good meal, but it can certainly have a greater impact when the customer is not aware of the brand.
- Outback Steakhouse: Casual steakhouse with a steak focus and Australian decor. Wide menu (despite the post-2020 reduction), full bar service and special snacks. Outback is Bloomin’ main brand in terms of volume and growth potential. Wide appeal mainly in the Brazilian and American market. It is the focus of the company’s improvement actions;
- Carrabba’s Italian Grill: Italian decor and food, casual and family atmosphere. Designed based on exhibition kitchen design, offering an interactive and transparent experience. The dishes are more focused on different pastas, but the meat dishes also shine. Besides Outback, this is the only brand exported by Bloomin’. Known in Brazil as Abbraccio;
- Bonefish Grill: Specialized in fish of all types. Valuing fresh food and seasonal dishes. Large wine list and elaborate alcoholic and non-alcoholic drinks;
- Fleming’s Prime Steakhouse & Wine Bar: Contemporary interpretation of the American steakhouse. Premium ingredients and more elaborate dishes. Focus on the gastronomic experience, award-winning wines and recognized and award-winning chefs;
- Aussie Grill: Fast casual focused on serving tasty and elaborate dishes (for fast casual) in less than four minutes. Targeted for younger guests and families seeking practicality and convenience.
Note that Bloomin’ multi-brand strategy allows the company to segment different audiences, with different promotional, pricing, targeted marketing and distribution strategies, and thus achieve greater effectiveness in each of these areas within these different operations.
Remember Deming’s quote “Good quality means a predictable degree of uniformity and reliability with a quality standard appropriate to the customer”. Or even what Crosby said “Quality is the consonance with requirements”. Therefore, Bloomin’ multi-brand strategy, by segmenting customers based on predefined concepts that appeal to different guests, adapts, through its value proposition, the intrinsic quality according to the needs of each segmented audience. This is the consonance of intrinsic quality with perceived quality, and only the latter generates the materialization of customer loyalty. What good is a high intrinsic quality if it is not perceived? This is the magic of market segmentation.
More scientifically, we can define perceived quality as the benefits (functional benefits + non-functional benefits) minus the sacrifices faced by a guest when visiting a restaurant. Like almost every factor we’re looking at here, both benefits and sacrifices are subjective factors and vary from guest to guest. In my other analyzes I comment extensively on the implicit and explicit benefits in the consumer decision-making process, but I think I never delve into the sacrifices. Basically, the sacrifices have to do with all the resources available to the consumer that can be invested in that specific product/service and not in alternatives, in other words, it is the famous trade-off.
They realize that each guest values “benefit X” more than “sacrifice Y” and therefore, the perceived quality will always be different. They understand that multi-brand segmentation also helps in leveraging and, let’s say (to borrow financial terms) “leverages” the perceived benefits and “deleverages” the sacrifices. In this way, there is an enhancement of the perceived quality.
Some other points that I would like to note are related to some trends in the casual dining segment and the industry as a whole that are becoming paradigms for the coming years.
It is interesting to note that the trend of a dizzying increase in off-premise sales, stronger in QSRs or in casual dinings that do not have as much brand appeal, has not yet reached the majority of Bloomin’ brands. Regarding this “threat” of increased off-premise sales in casual dining restaurants, I recommend reading my article about Chuy’s (CHUY). Let’s compare the numbers for 2022 with those for 2023. In the United States segment, no brand showed a relative increase in off-premise sales, on the contrary, while Bonefish and Carrabba’s kept their proportions untouched, Outback and Fleming’s increased their proportions sales in restaurants. In Brazil, this proportion also grew by 1% in 2023.
We can therefore infer that this is a competitive advantage for the majority of the industry. The capacity for loyalty, up-selling and cross-selling is much greater when sales occur within the establishment (in the case of casual dining), where the restaurant will have all the environmental factors in its favor to ensure that its intrinsic quality is perceived by the customer. In other words, it is a sign of time preference for the restaurant’s value proposition.
Another very interesting revenue paradigm in the industry is the diversification of services through the expansion/flexibility of operating hours. A very recent example of Bloomin’ efforts to maximize its sources of revenue was the offering of brunches at Bonefish now on Saturdays, in addition to the introduction of new dishes with a high GP, such as Bang Bang Shrimp. Plus, the addition of unique drinks like the Mimosa with LaMarca prosecco.
Another notable example is the inclusion of bistro sandwiches, versions of Italian classics, served at Carrabba’s Italian Grill during lunch hours for $13.99. Note that the addition of these sandwiches is aimed at customers looking for a more dynamic and affordable meal, but without giving up the Carrabba’s experience.
These efforts are part of an extension of the mix of products offered. From a broader portfolio, a restaurant can increase turnover at times considered “weak” and gain a number of customers who did not adapt to the previous value proposition and consequently a stronger revenue. It is nothing more than the company’s customer orientation.
Furthermore, I see that there is a pressing need in the industry to re-attract low-income consumers, who have been decreasing their frequency of visits to casual dinings and even QSRs for some time. That’s why we’ve seen restaurants (mainly casual dining and fine dining) increasing menu prices in order to compensate for the decrease in traffic from an increase in the average check per guest.
And that’s why we’ve seen an increase in promotional environments, especially in QSRs and fast casuals. Notice the sign of the times. Burger King from Restaurant Brands International (QSR) is back with its $5 meal promotion. Wendy’s (WEN) increased the breadth of its product mix and daily park rotation by offering breakfast starting at $3. Starbucks (SBUX) and McDonald’s (MCD) have also increased promotional offers aimed at re-engaging this low-income consumer.
Is it necessary to urgently scale up promotional environments in casual dinings? I don’t see it as such. The second semester will bring interesting news. Until then, casual restaurants that are knowing how to use the advantage of their superior position are managing to increase the average check per guest in order to compensate for the decrease in traffic, since due to the very nature of the business, demand is much more elastic. When it comes to QSRs, price is the primary component. Therefore, I don’t see the need for the escalation of promotional environments while the average check is growing. But in the long term this strategy is unsustainable.
Expansion and remodeling project
If you have followed the developments of large companies in the restaurant industry, especially when it comes to casual dining, we noticed a common need: the development of more economical and lean units. It is clear that if the company is successful in reducing the initial investment and maintenance costs, it will optimize both the return on investment, reduce the project’s payback and optimize the operational and financial structure of this asset.
And this is translated by the Cost-Benefit Index, which compares the resource flows from this asset to the present value of the initial disbursement to complete the project. Large players are already basing their expansion projects on the new unit models. The CEO of BJ’s (BJRI), for example, sees potential in doubling the number of restaurants on American soil after the success of the new lean unit in Wisconsin. Chuy’s is also opening new locations based on a more economical design.
Note that this paradigm is not restricted to casual dining restaurants, but has been accelerated following the new post-pandemic consumption patterns. We have already been following a similar change in QSR’s, which benefit from increased turnover much more than casual dining, as their value proposition is based more on dynamism than on added value. Another important factor for this key turnaround is the increase in off-premise sales. Although they are not yet as representative in casual dining as in QSR’s, there is a general consensus in the industry that the lean model will optimize the physical space and operational effort that would previously be concentrated in the lounge. I’ll talk more about Bloomin’ off-premise sales in the section where I talk about operationality.
And anyone who thinks that Bloomin’ would stay out of this is wrong. Since 2021, the company has been opening Outback Steakhouse restaurants in the “Joey” model. With 5,000 square feet and capacity for 190 guests, the new model makes the Outback brand’s expansion projects much more attractive. In fact, in Brazil all Outbacks opened since 2021 use this unit model. The only difference between the American model and the Brazilian model is that as these restaurants are often built inside shopping centers, there is a more elastic need for the size of the room, which can be on average 4,800 square feet.
In conjunction with the implementation of the Joey model, Bloomin’ has been adapting old models by installing advanced ovens and grills. This is part of a set of guidelines aimed at operational efficiency and increasing return on investment per unit.
I didn’t find enough data to model the cost-benefit of the new units for you as I did with Chuy’s and BJ’s. If I find it in my next review I will bring a comparative analysis of the expansion prospects of the casual dining sector in a separate analysis.
Financial analysis
Leverage and debt considerations
Naturally, we will start our financial analysis of Bloomin’ with its financing policy. Basically, the objective of every financing policy aims to achieve an ideal structure in terms of funding sources based on a given asset composition. In the case of Bloomin’, we noticed a clear preponderance in the use of third-party capital to the detriment of equity. The following table shows the percentage of assets (in the form of total investments) that are financed from third-party resources:
Author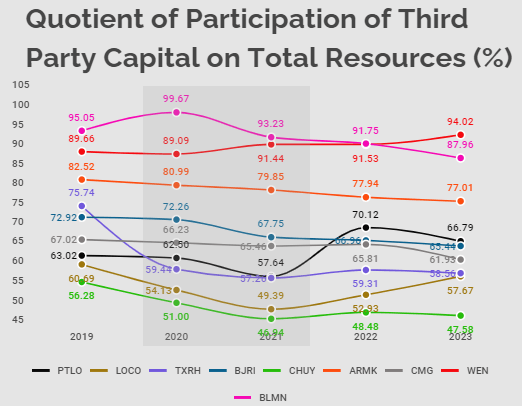
Compared to Wendy’s, for example, which is leveraging itself even more after 2020, Bloomin’ is going through a deleveraging process in the same period. Equity grew from $229 million to $412 million (more than 80% growth) in two years. This movement was halted in the first quarter of 2024, but clearly impacted both the return on shareholder capital and interest payments in relation to operating profit. Therefore, given its financing structure, it is essential to analyze Bloomin’ leverage and how the company is dealing with economic and financial risk.
I would like to make a brief addendum: In this analysis I will discuss some concepts that may often seem to require a prior explanation. With that in mind, I recommend reading my latest review published by Seeking Alpha. There I explained in detail most of the concepts that I will use in this analysis. If you prefer me to explain these concepts again in each new analysis, let me know in the comments. For now, when I refer to a concept that has already been explained in one of my articles I will add the link and give some instructions on where you can find it.
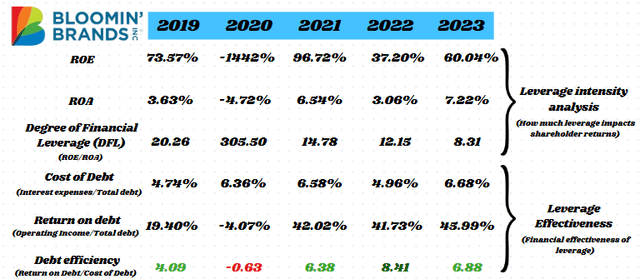
To answer whether the company is incurring too much economic and financial risk, we have to combine the analysis of two very important indicators for the study of debt. The first is the Degree of Financial Leverage (DFL), which basically measures how much the shareholder return was leveraged from the return on total assets. Therefore, the lower the composition of equity capital, the greater the discrepancy between the return on total assets and the return on equity, highlighting the company’s degree of leverage.
The second indicator was named by me as Debt Efficiency. Basically we compare the return on debt with the cost of debt. If the Debt Efficiency indicator is positive, it means that the company is generating a return on that capital raised from third parties that is greater than the cost it pays to use it. Naturally, if the return is lower than the cost paid for using this capital, Debt Efficiency will be negative. Note that for the materialization of a positive Debt Efficiency it is necessary for the company to produce a strong operating profit capable of offsetting an explicit cost of third-party capital in the form of interest.
You can find a more precise definition of Financial Risk and Economic Risk in my last article. But in short, the economic risk arises from the company’s inability to pay the interest on its debt, while the financial risk arises from the variability of shareholder remuneration.
I feel that the explanation about Financial Risk is somewhat confusing. To clarify this concept, we will explain it in more detail. Given a specific degree of variability in the operations of any company (and all, literally all companies are subject to factors that vary their results), the greater the percentage of third-party resources that finance the company’s assets, the greater the risk assumed towards the common shareholder. Think with me. If there is a decline in operating results, a certain amount of the funds generated will be used to settle commitments with third parties, thus reducing the proportion of capital allocated to the common shareholder.
Note that Economic Risk is related to the ability of assets to generate a return sufficient to cover the cost of debt. While Financial Risk is derived from the structure of the company’s liabilities, especially when we talk about leverage and relative debt. Therefore, even when we talk about financing, we must always count on the operability aspects of the assets, as they are fundamental to justify (or not) leverage. To make it clearer, let’s graphically portray a situation of Economic Risk and Financial Risk:
Risks incurred in different companies (Author)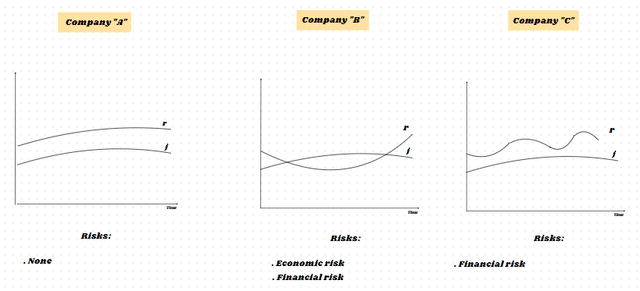
In the figure above, lines “r” represent the return from third-party capital, while lines “j” represent the explicit cost of this capital. It doesn’t hurt to remember that the more indebted the company is, the more leveraged it will be and this will increase the need to generate resources to pay interest and will make the return on equity much more volatile. It is not that this situation becomes a risk in itself, as we have seen in previous analyzes that according to the Solomon-Durand Cost of Capital Theory there is an inverse relationship between debt and the weighted cost of capital of a company, but only up to a certain point. Rather, there is a susceptibility for indebted companies to present greater economic and financial risk when economic factors are affected by exogenous (market) conditions.
Note that Company “A” has a much lower Financial and Economic Risk than the other two companies, since it obtains resources that are often higher than the cost of its debt and has minimal variability in operational results, guaranteeing stability in terms of shareholder remuneration. Company “C”, despite managing to escape Economic Risk, since it constantly generates resources from third-party capital that exceed the cost of debt, still incurs Financial Risk. Note that, even though it is always higher than the cost of debt, the return on debt is very volatile, making shareholder remuneration unstable. Company “B”, on the other hand, incurs both Economic Risk (the company is constantly unable to obtain the necessary return to bear the explicit costs of third-party capital) and Financial Risk (the volatility with which the company’s operations suffer as extrinsic variables make with the remuneration of partners being, in many periods, volatile or even non-existent).
Now that I have finished my considerations on the subject, we will continue with the analysis of Bloomin’ debt and then I will talk about the risks faced by the company:
Firstly, I would like to point out what I have already said previously. Bloomin’ has gone through a period of deleveraging since the end of fiscal 2020, when it incurred a loss due to demand restrictions caused by the pandemic. Precisely in that year, Bloomin’ was at the height of its leverage, using approximately 99.67% of third-party capital in its financing structure. This caused the company to report a very negative return on equity. From that year onwards, the company went from 99.67% to 87.96% in terms of the use of third-party capital in its assets. Note that after this loss of leverage, the DFL indicator showed increasingly smaller numbers. This means that there is a smaller discrepancy between the return on assets than the return on equity, as there is now a comparatively greater share of the latter.
Regarding Debt Efficiency, we can infer that in the last ten years only once was the operating profit unable to correspond to the explicit remuneration of third-party capital. This year, as you already know, was 2020. Since 2019, the average Debt Sustainability indicator was approximately 5.02. When we compare this number with other major brands, we can infer that Bloomin’ is in the first or second quartile when it comes to Debt Efficiency. Wendy’s, another example of a company in debt, but which, unlike Bloomin’, has experienced an increasingly intense leverage process recently, has an average Debt Efficiency of 2.17 over the last five years.
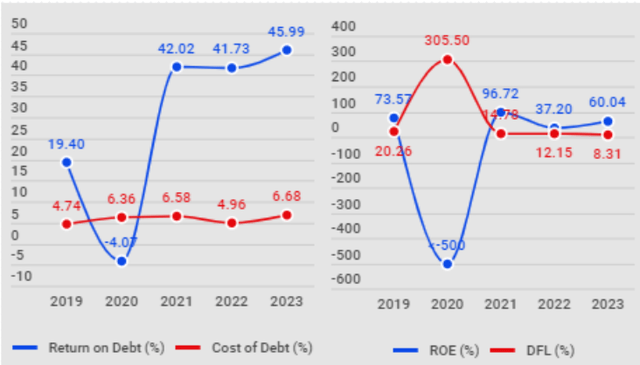
The following graph exemplifies this relationship between the DFL and Debt Efficiency in the last years of Bloomin’:
Author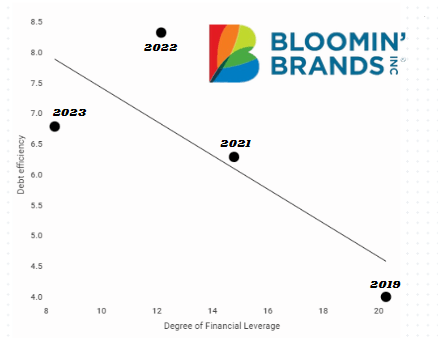
From the trend line, we can infer that while Bloomin’ reduces its leverage, it is succeeding in obtaining higher returns on its debt. This is evidenced by the shortening of the DFL indicator and an upward trend in Debt Efficiency. In this graph I excluded the year 2020 to make it easier to see. Note that, through deleveraging, Bloomin’ is reducing both Financial Risk (since the variability of shareholder returns is decreasing, just analyze the discrepancy between ROE and ROA, evidenced by the DFL) and Economic Risk (the trend increase in the Debt Efficiency indicator is highlighting this fact).
Let’s look at this situation in another way. The following graph is a similar representation to the one I presented here when I discussed the two risks mentioned above:
Now I think it is clearer that from 2020 onwards, along with the deleveraging, the company started to present a more stable ROE, despite still being very leveraged. This can be evidenced in the table on the left, where with a declining DFL, ROE becomes less susceptible to very sudden variations as we saw in 2020, reducing Financial Risk somewhat. Now, the picture on the right represents that Economic Risk is under control for the reasons I mentioned in the previous paragraph.
Other interesting metrics that we can analyze regarding the company’s debt concern the ability to cover the debt from the operating result (how many times is the operating result able to cover the interest expense?) and the ability to pay the debt principal from operating cash flow. A deterioration in these metrics will indicate an increasingly cluttered solvency. Let’s go to the metrics:
Author
As interest coverage from operating results is proportional to the Debt Efficiency indicator, we can notice a similar trend between these two indicators. Now, the indicator of the ability to pay the principal through operating cash flow has improved significantly in 2023. This was due to some factors, including the net profit of the last ten years, reinstatement of the company’s non-monetary operating expenses depreciation and a moderate flow from other operating activities.
Let’s now move on to another very important topic that surrounds the entire financing management of a restaurant chain: immobilization models. The way a company immobilizes its assets is very important, since the type of resources that the company uses as financing says a lot about its debt policy, need for debt renewal, liquidity and its average terms. More important than this is the reason why the company opted for the fixed assets that it presents on its balance sheet.
Understanding these phenomena requires an approach known as “Dynamics” in corporate finance. Before opening the next section of this text, as we agreed previously for the fluidity of the text and to avoid repetitions of explanations already given, I will leave some links to other articles I wrote where I explain in detail what Dynamic analysis proposes, its contrasts and parallels with Orthodox analysis and many other concepts that I will use here. You can find a more didactic explanation in my article about Wendy’s, right after the considerations on capital cost. Therefore, if you are not yet familiar with Immobilization Theory or Dynamic Analysis and Orthodox Analysis, I strongly recommend reading these concepts beforehand.
Immobilization Theory, Net Working Capital, Cycles and Dynamic Analysis
To begin our analysis of the type of fixed assets and the financing model and distribution of different types of resources within Bloomin’ financing structure, we will analyze whether or not there is the figure of net working capital within Bloomin’ equity structure. Remember, restaurant chains that work with maximum efficiency have a negative cash cycle and are therefore able to immobilize all of their non-current resources and a part of their current resources. Therefore, these companies that maintain a “Dynamic” fixed assets model do not have net working capital, since by receiving money from their customers before paying their suppliers, they enjoy an optimized capital flow.
Precisely because they can immobilize all their non-current resources and a part of their current resources, these companies use commercial credit (evidenced by the high average payment period for suppliers) to deal with both the financing of current assets and the maintenance of its fixed assets. In other words, they have the competitive advantage of not needing long-term financing which, in addition to cluttering the operational structure by increasing interest expenses, demonstrate a policy that “sweeps under the carpet” the problems inherent in credit policy. The ideal for Bloomin’ in this section is that we highlight the following characteristics: negative net working capital, “Dynamic” type of fixed assets, short operating cycle, negative cash cycle and a need for negative cash flow through the Fleuriet Model. Let’s analyze:
Author
What does the sectioned analysis of net working capital have to tell us? Firstly, negative own working capital is an indication that fixed assets exceed equity in all periods analyzed. And this was already imaginable, since in the first section we already noted that equity capital was the smallest part of Bloomin’ sources of resources. This indicates that to complement the fixed assets, Bloomin’ would need a portion of long-term liabilities. Note that, even though they account for a large part of the fixed assets (especially when we talk about capital leases and long-term debts), non-current liabilities do not complete Bloomin’ total fixed assets. This indicates that the company immobilizes all of its non-current resources and also a part of its current resources.
We came to the conclusion that Bloomin’ maintains an immobilization model that, according to the Immobilization Theory, is considered “Dynamic”. However, maintaining the Dynamic model is only possible when the company has a negative cash cycle, since to maintain current resources tied up it needs to optimize its cash flow through the gap between receipt from customers and payment from suppliers. Before analyzing the cycles, let’s explain the Dynamic immobilization model graphically:
Author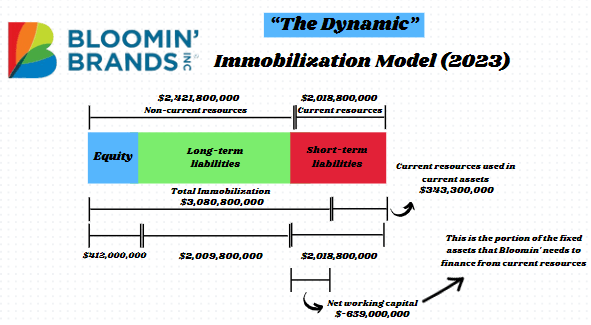
We saw previously that Wendy’s does not have the Dynamic immobilization model precisely because its long sales receipt periods do not allow for the immobilization of current resources, as its cash cycle is not negative. We have other examples of unsuitability for the Dynamic immobilization model. Chuy’s, for example, despite having a negative cash cycle, the company seems to maintain few resources as fixed assets (this was one of my reasons for doubting the company’s growth with its meager investments, even with a very positive expansion panorama with its cheap units), with its non-current resources surpassing its total immobilization. The first tip to know if a company can maintain a Dynamic immobilization model in a healthy way is to analyze the cycles. Only with a negative cash cycle will a company be able to efficiently immobilize current resources. Let’s take a look at Bloomin’ cycles:
Author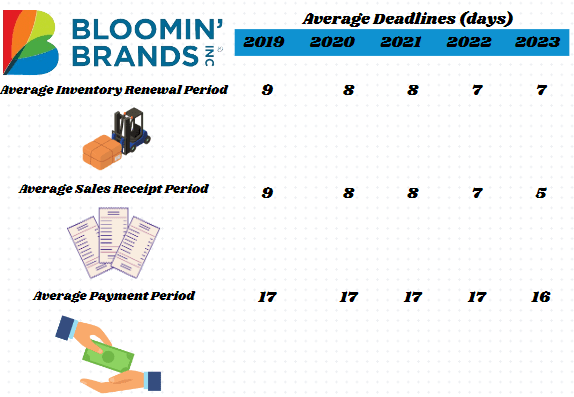
Author
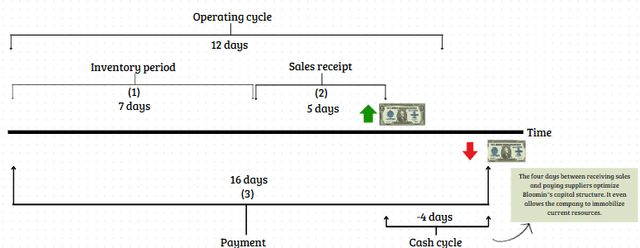
Since 2019 Bloomin’ has been improving its cash cycle in order to adapt to the Dynamic immobilization model. This was only due to its efforts to increase inventory turnover through automated management systems (this is one of the industry paradigms, remember AI-based inventory management systems) and an adjusted credit policy, which aims to shorten receipt times for your sales. When we talk about the company’s credit policy, it is important to balance deadlines and terms agreed with customers. Therefore, it is interesting that the company maintains a certain paradigm in its credit policy that makes it somewhat flexible to meet customers’ wishes and strengthen relationships, but without disturbing its cash cycle, especially when you tie up current resources. Therefore, if a company seeks to increase its receipt deadlines as a way of increasing consumer appeal, it is interesting to pre-negotiate an increase in payment deadlines with its suppliers, in order to keep the cash cycle unchanged. Therefore, it is perfectly valid to infer that Bloomin’ is succeeding in maintaining its Dynamic immobilization model not by increasing its average payment term, but rather by shortening the operational cycle.
All these dynamics can be represented graphically. See below how this situation with Bloomin’ cycles works in practice:
To conclude our analysis of Bloomin’ capital structure and fixed assets, I will present Fleuriet’s Dynamic Analysis Model here. If you still don’t know how the relationship between Cyclical Assets and Cyclical Liabilities works, I highly recommend reading my Wendy’s article, where I explain this relationship in greater detail. However, in short, a dissonance between Cyclical Liabilities and Cyclical Assets represents an optimization of the company’s operational structure. This is due to the fact that Cyclical Liabilities are predominantly represented (there are others) by accounts payable and Cyclic Assets by inventory and accounts receivable (there are also others). Therefore, the preponderance of Cyclical Liabilities would basically indicate what we have already seen in the cycle analysis, a shortened operating cycle and a negative cash cycle.
Author
Structural risks and bankruptcy forecasting indicators
Companies that have a large preponderance of third-party capital in their capital structure need to be structurally analyzed a little more in-depth than others with a more conservative capital composition. In this field of study, great intellectuals in the field of finance published quantitative models that identify structural problems according to the data presented in the financial statements.
Of all these great academics, one name that stands out is Edward Altman (mainly in the United States). Altman published an article entitled “Financial ratios, discriminant analysis and prediction of corporate bankruptcy” in the Journal of Finance in 1968. This work became known as the cornerstone of predictive balance sheet analysis and formulas for predicting bankruptcy or structural risks.
I think it will add value to the analysis if, in addition to analyzing Bloomin’ under Altman’s quantitative model, we also use some well-known author in Brazil to add some color to our presumption of solvency (or insolvency).
So, let’s start using the “Kanitz Thermometer”, developed by the famous author and business consultant Stephen Kanitz. In the figure below I used the Kanitz Thermometer to measure Bloomin’ Brands’ structural risk:
Author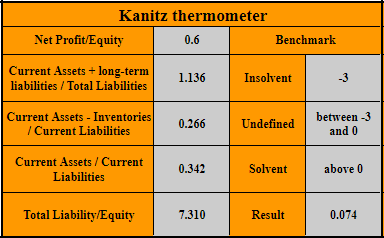
Note that under the Kanitz Thermometer, Bloomin’ shows no signs of structural risks. Of course, as the Kanitz Thermometer was developed (like most bankruptcy prediction models) with liquidity perceived under the lens of Orthodox analysis, that is, without considering the analysis of cycles and the Fleuriet Model, which deals with liquidity in a fickle and dynamic way, like the name of the theory it is part of. Therefore, if for the Orthodox Theory, good liquidity means an excess of assets over liabilities, without considering cyclical accounts and erratic accounts, companies that use the Dynamic Immobilization Model may present lower rates when we deal with structural risk indicators. With this in mind, we will use the model proposed by Altman in 1968.
Author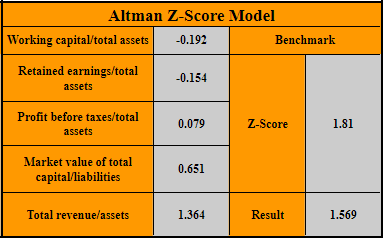
Note that, precisely due to the negative relationship between working capital and accumulated profits with total assets, the Altman Model classifies Bloomin’ as below the “Z-Score”. For reference, regarding the Altman Model, Texas Roadhouse (TXRH) presented multiples of 6.226, Chuy’s of 3.306, BJ’s of 2.226.
I do not believe that Bloomin’ is an insolvent company, as this can be challenged when we are aware of Dynamic Analysis and its particularities, even more so when we consider the details of the restaurant industry that have a characteristic type of immobilization. All of this must be put into perspective if we want a holistic analysis of Bloomin’. Another important factor is that the Kanitz Thermometer effectively identifies a solvent company 8 out of 10 times.
Operability
Even though I have already discussed this previously, I believe it is of general benefit to break down Bloomin’ sources of revenue here in more detail. This way we can segment the operational centers and provide more accurate opinions on the company’s situation.
As I said previously, the company has two distinct reportable segments. The first occurs through the geographic area corresponding to the United States. This segment includes four distinct restaurant concepts. A brief addendum here. “Concept”, when we talk about restaurants, is the guide for the entire value proposition and guidelines that make a restaurant’s identity tangible. The five concepts covered in the American reportable segment are: Outback Steakhouse (Casual Dining), Aussie Grill by Outback (Fast-casual), Carrabba’s Italian Grill (Casual Dining), Bonefish Grill (Casual Dining) and Fleming’s Prime Steakhouse & Wine Bar (Fine Dining). Remembering that, as I have already qualitatively broken down these concepts in the first section of this analysis, here I will only focus on the quantitative and/or operational aspects.
In the United States reportable segment, as of the end of last year, Bloomin’ Brands owned and operated 998 restaurants. In addition, the company franchised 152 restaurants until that same date. This means that the United States segment has a total of 1,150 restaurants in total.
The international reportable segment encompasses two of Bloomin’ five concepts, which are Outback Steakhouse and Carrabba’s Italian Grill. It is important to highlight that Bloomin’ has a decentralized management network in the countries where it operates, which allows support for international operations integrated with the corporate headquarters. By the end of 2023, the company directly owned and operated 191 restaurants and franchised 139. This means that the total international operation has 330 restaurants spread geographically across thirteen countries.
This situation is shown in the table below:
Author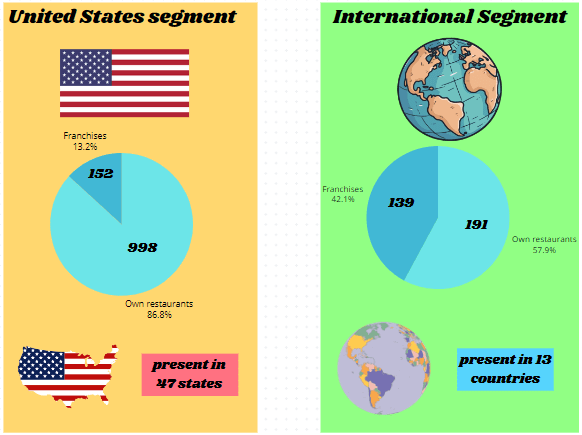
Another important factor for us to analyze is the opening and closing of restaurants during the 2023 fiscal year. We have already talked about the Joey Model and its economics, now let’s find out where the brand is expanding and where it is shrinking.
During fiscal 2023, the United States reportable segment declined across nearly all of its brands and management models (except the first Aussie franchise in the reportable segment). Among the brands, the highest number of closures was at Outback Steakhouse, which reported around 10 closures of its own units and one franchise. These closures were partially offset by the opening of six new units managed by Bloomin’, during which time no Outback franchises were opened within the United States. This culminated in a net reduction of four Outback units, i.e. a reduction of just under 1% in the number of total units.
Still in this segment, Bloomin’ recorded the closure of its own Carrabba’s Italian Grill unit; three closures of Bonefish Grill’s own units and two franchises of the same restaurants, partially offset by a new franchise opening; a closure of Fleming’s Prime Steakhouse & Wine Bar; closure of three Aussie-owned units, offset by the opening of a franchise. In total, there were eight unit openings and 21 closings in the segment, a reduction of 1.12% in the number of total units. I don’t have enough data to say whether these drives that were closed had the “Joey” formatting we talked about earlier.
In the International reportable segment, the most important developments were the opening of 16 Outback Steakhouses in Brazil, without presenting a single closure, and 16 openings in South Korea offset by 10 closures.
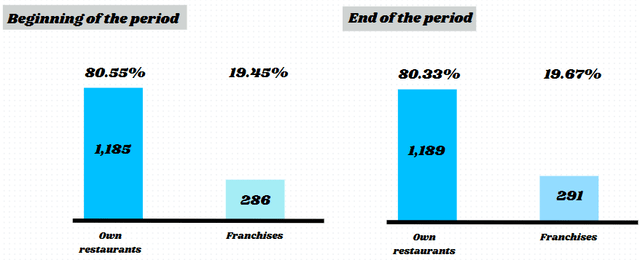
Overall, Bloomin’ opened 24 company-owned restaurants and closed 20, ending the year with 1,189 company-owned restaurants worldwide. Regarding franchised restaurants, 22 opened and 17 closed in 2023, ending the year with 291 restaurants.
Given the developments explained above, the composition of own restaurants and franchises was as follows:
Note that there was not much difference in the composition of the units, with growth in both management models. This occurred as international growth was offset by more closures within the United States segment.
In this regard, when we look at the most recent developments, we continue to see continuity in terms of remodeling and relocations. The only difference is the openings. Bloomin’ intends to open approximately 40 to 45 restaurants during fiscal 2024, of which 15 to 17 would be within the United States. In other words, around 37% of new planned openings are expected to occur in the United States reportable segment, while 63% of new openings will be in the International segment. This indicates that the company (as we saw in the Wendy’s analysis) plans greater growth in its International segment, since as we will see in a moment, it presents a much faster growth in revenue year on year.
Now that we have exhausted the subject of openings and closings, let’s turn to revenue for the 2023 fiscal year. In the following figure I have segregated revenue according to the source it comes from (sales in company-owned restaurants and royalties):
Revenue in each segment (Author)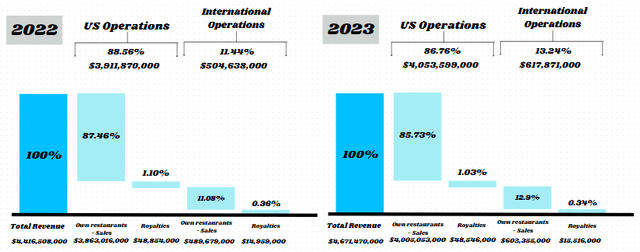
Note that both segments showed similar growth in volume, however the growth in the international segment is impressive when analyzed in comparison to the previous year. Revenue growth in volume for Bloomin’-operated restaurants in the United States was $142,037,000, approximately 3.67% when compared to the previous year. Now, Bloomin’-operated restaurants in the international segment have seen revenue growth of $112,676,000, or 23% year over year.
But what were the factors that made Bloomin’ report higher revenues even with a negative unit balance in fiscal year 2023? I explain. In 2023, sales in comparable restaurants grew by around 1.4% in the aggregate of operations in the United States segment, with Outback Steakhouse growing by around 1.1%. Despite the reduction in traffic, Bloomin’ managed to increase the average volume per restaurant across all its brands and, consequently, increased the average check per customer.
In Brazil, despite the company not presenting the explosive numbers we saw in 2022, when the comparable basis was a year that was affected by the pandemic, Bloomin’ managed to increase comparable sales by 5.5% and the average check per customer by 6.5%, just losing 1.1% of traffic.
This typical scenario of periods of economic turmoil and high interest rates requires companies in the restaurant industry to adapt in order to maintain growing revenue. When we talk about casual dinings, this scenario takes on a little more color. I mean, although this segment presents a little more difficulty with turnover in macroeconomically troubled periods, there is an advantage in relation to QSR’s: the creation of value. That’s why we’re seeing companies increasing their prices and “testing” the extent to which customer preference allows this elasticity without losing the brand’s appeal and guest preference. This elasticity depends precisely on the difference in the value proposition to the market, and I can see this in Bloomin’ brands.
In conjunction with this panorama, marketing strategies come into play: promotions, digital marketing, sales strategies. But remember, all these strategies won’t work if the brand doesn’t appeal to the market, and that’s what makes a company able to maintain strong revenue and comparable sales growing year after year.
Looking at short-term patterns, let’s briefly look at Q1 2024 revenue before moving on to look at margins. In the table below I inserted Bloomin’ quarterly revenue data:
Author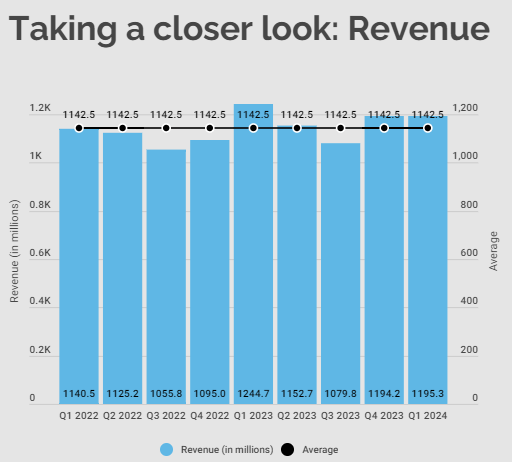
Note that although Q1 2024 revenue was almost 4% lower than Q1 2023, it represented growth of 0.09% compared to the last quarter and 4.62% higher than the average of the last two years. In this last quarter we saw a decrease in comparable sales of around 1.60%, in line with what the sector expected. This comparable sales result is approximately 2.30% higher than that of the industry, which was affected by unfavorable weather in January (this was also reported by BJ’s, Portillo’s, Chuy’s among other companies). Furthermore, according to David Deno, CEO of Bloomin’, the company also surpassed the industry average in terms of guest traffic. The main vector for these first quarter results was Outback (as always), which presented a very interesting performance, surpassing industry traffic by 2.4% and 2.7% in sales.
Despite this panorama, the numbers are not very good. There was a 4.6% drop in sales revenue in the United States segment and a 2.8% drop in franchise royalties. Still in the United States segment, all concepts showed a drop in revenue: Outback Steakhouse fell 3.9%; Carrabba’s Italian Grill lost 1.9%; Bonefish Grill fell 8.3%; Fleming’s Prime Steakhouse & Wine Bar lost 6.4%. On the other hand, operations in the International segment grew approximately 0.62%, with an approximate 2.3% growth in sales in Brazil and a 7.3% drop in other countries (despite these other countries representing less than 20% of international sales).
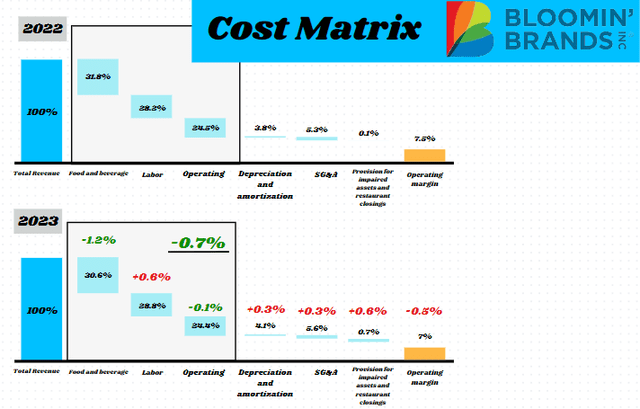
Let’s start talking about operating costs and the nuances of operating margin. In the following figure I break down operating costs in relation to gross revenue:
Firstly, let’s address the class of operating costs. These are the main cost centers when we talk about restaurants. There is a well-known rule in the industry which is 30/30/30. It is a general rule but establishes as a certain acceptable limit the use of 30% in each operating cost class. And notice that even the operating costs arising from food and beverages remain above this limit. Management has been reporting that compared to the rest of the industry, it is very skeptical about a very large increase for consumers.
See, the reduction in food and beverage costs in the first quarter was only possible from a 2% increase in the average check per guest, a moderate increase when compared to other restaurants we are seeing out there. Secondly, food and beverage costs were alleviated due to cost reduction programs that are being implemented as part of a continuous improvement program in operational efficiency since 2021, the same year in which the first “Joey” unit was implemented. These reductions were offset by a 1.3% increase due to commodity inflation.
Note that most of the results generated by Bloomin’ come from increases in the average check per guest. It is expected that in addition to price, the company will increasingly reorganize its menu, in order to increase the profitability of its product mix. Anyone who has been to Outback before the pandemic may notice a certain reduction in the menu. And this is part of the company’s attempt to make its menu leaner, in order to increase both operational efficiency (as there are fewer different dishes for the kitchen staff to prepare) and increase the GP of its product mix as a whole.
This is a broader topic about menu engineering, which we cannot expand on too much without straying from the main topic. But for the record, menu engineering aims to maximize the GP and volume sold of each menu item. But a restaurant isn’t just about GP. An elaborate analysis of a gross cash inflow is important, which is only provided by more elaborate items or imported wines, for example. It is important that Bloomin’ uses a matrix similar to BCG, but is adapted for food and beverages sold in restaurants and considers the volume and margin of each item. In this sense, I would like you to realize that just increasing prices is just the “tip of the iceberg” when it comes to increasing the average check per guest. Other more creative solutions that do not have the negative appeal of a simple and pure price increase are, for example, reducing portions, changing dishes so that they require complements (increases cross-selling), removing items from “volume” in periods of reduced traffic (products with tighter margins), staff training for upselling and cross-selling, among other creative solutions. The sky is the limit.
Labor expenses have increased across the industry due to wage inflation that remains quite strong, and it was no different with Bloomin’. In fact, if I’m not mistaken, the only company that managed to reduce labor costs recently (that I’ve read the reports) was BJ’s Restaurants. But this was a specific case in which operational costs were previously erratic and there was an excess of non-optimized costs that did not concern salary inflation only. At Bloomin’ during fiscal year 2023 there was an increase of 1.6% which was partially offset by the increase in the average check and 0.2% by one-off improvements.
This is a very difficult group of operating costs to deal with. Specific changes such as changes in salary or job and promotion plans may not have much effect on costs, which are being directly affected by fiscal and monetary policy decisions. In fact, certain restrictions on employee remuneration can have the opposite effect, driving away talent from the operational and management team. Long-term actions should focus on optimizing personnel from the new, leaner units.
The secret is how many employees Bloomin’ can keep in the room without affecting the quality of service, which is really fundamental when we talk about casual dinings and full-service restaurants. As the service is intangible, immeasurable and irreproducible, it is very important that service management is very rigorous in making services the best possible. Regarding the service and contact with any employee of the Outback team, I have nothing to complain about, as a consumer they have always been kind and attentive to me.
Speaking of other operating costs, we were able to observe a reduction of 0.1% in fiscal year 2023, remaining practically stable in these two years.
Now, when we talk about operating expenses, we are talking here about depreciation, SG&A expenses and the provision for depreciated assets and restaurant closures.
Depreciation expenses increased as fixed assets also grew from year to year (during fiscal year 2023 tangible fixed assets grew approximately 5%). Naturally we would see growth in this group of non-monetary expenses. General and administrative expenses grew by 0.3% in 2023 due to higher legal fees, travel expenses and general remuneration. Now, the increase in the provision for impaired assets and restaurant closures occurred due to the recognition of the reduction in the recoverable value of some assets and additional costs arising from the “2023 Closure Initiative”, which we already saw when we talked about openings and closings. As a result, the company had to bear costs related to the liquidation of these assets, in addition to other legal expenses, such as: compensation, breach of rental contracts and others. Within the framework of the “2023 Closure Initiative”, two Aussie restaurants in the International segment and 36 underperforming American segment assets were liquidated.
Mainly due to operating expenses and the increase in labor costs, Bloomin’ presented an operating margin in 2023 that was 0.5% lower than that of 2022, even with the reduction in food and beverage costs and other operating costs.
Let’s take a look at the quarterly situation. In the graph below, we will follow the trajectory of both operating profit and operating margin in recent quarters:
Author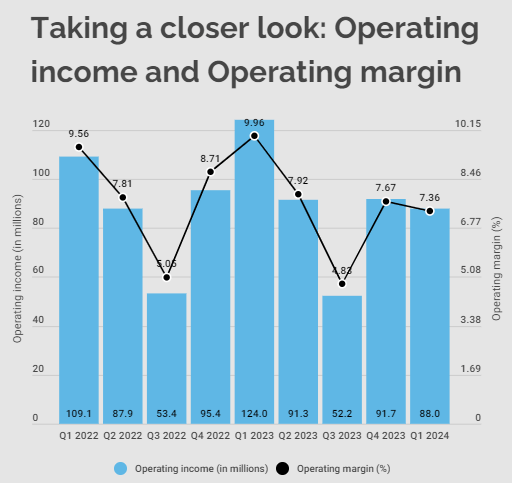
Although in the first quarter of 2024 we see a return in operating margins to levels close to what we saw in 2022, compared to the first quarters and the immediately previous quarter we see relative weakness. What is the reason for this? As occurred with other restaurant chains, in the first quarter operating margins were affected by unfavorable weather and the change of the 53rd week of the calendar year. These two factors together impacted the operating margin by approximately 1.1%. Operating costs were impacted by higher wage inflation (increasing labor costs by 4.5%). Food and beverage costs remained stable, with a neutral/downward trend, as did other operating costs.
Among operating expenses, there was a $7 million increase in advertising expenses, in addition to an increase in asset depreciation as the company invests in fixed and long-term assets.
Other factors that were less significant but worth mentioning are the loss of tax benefits in operations in Brazil, affecting the operating margin in the first quarter of 2024 by 0.3%. It was not very clear which exemption came to an end for Bloomin’ , but the first quarter was marked by a 4% drop in revenue in the International segment, in which Brazil accounts for the majority of operations (87%), which is leading the company to consider which management model would be the most appropriate for operations in Brazil. One option would be to franchise the restaurants and use the cash on hand to increase dividends and buybacks, if the company does not find other investment options in the United States segment.
Now, before we talk about net profit, it is important to understand the impact of loss on debt extinguishment and what this non-operating expense represents. Before talking specifically about the cost of capital and the strategies used by Bloomin’ to reduce it, let’s remember how and how much the company repurchased part of these notes that would mature in 2025. The agreement in force was the advance payment of the amount of $83.6 million, consisting of $3.3 million in cash on accrued interest and 7.5 million shares of the company’s common stock.
In addition to these extraordinary expenses that harm the net result of the first quarter, can we get anything good out of all this? We should add that Bloomin’ again increased its debt, incurring a long-term credit line of approximately $550 million. This movement boosted the company again, which now finances 91% of its total resources from third-party resources (at the end of the fourth quarter this ratio was 87% of resources financed by third-party capital). This indicates that debt levels have returned to the levels we saw in 2022, with the DFL of 12.15.
With the advance payment of this obligation and the increase in shares in circulation (apart from the paltry disbursement of $3.3 million) and increased leverage in a period of decreasing sales, uncertainty in the International segment and labor cost pressure, I rephrase my previous question, Did Bloomin’ get anything good out of this story?
I can mention two things, one resulting from the other. The first is that there was a decrease in the company’s debt cost. By calculating the interest incurred as non-operating expenses, we see a projected debt cost for fiscal year 2024 (if the debt assumptions remain the same) of approximately 5.7%. The broader consequence of this is a decrease in Bloomin’ weighted cost of capital at the end of the day.
Anyone who remembers my last article about Wendy’s will remember that we talked about the Classical Cost of Capital Theory, or Solomon-Durand. In short, due to the very nature of third-party capital (limited, fixed and with explicit and periodic remuneration) its cost is lower than the cost of equity. This difference is mainly due to the risks inherent to the capital of each type of supplier. With this in mind, the greater the debt (the greater the participation of third-party capital within a company’s capital structure), the lower its weighted cost of capital will be, given the concentration of capital at a lower cost. This indicates that according to Classical Theory there is an ideal capital format that can be formatted through a company’s financing policies.
To achieve this optimal level of capital formation, a company should extend its debt to the point where the weighted cost of capital responsiveness equals zero, or worse, starts to rise. In this case, given a certain level of debt of a company, creditor institutions will begin to doubt the company’s sustainability in paying the natural explicit remuneration of the debt. Note that this “inflection point” is related to the intrinsic and specific capacity of the resource-borrowing institution, indicating that each company, depending on its payment capacity, has a distinct “inflection point”, and therefore, a capacity of different leverage and debt. As we saw in the first section of the financial analysis, Bloomin’ has a very small economic risk (see the Debt Efficiency indicator) and, therefore, debt at more pleasant interest rates contributed to the reduction in the cost of debt and, due to the company’s capital structure, a reduction in the weighted cost of capital.
Now that I’ve explained how extraordinary items impact quarterly net income, let’s take a look at net income and net margin on a quarterly and yearly basis:
Author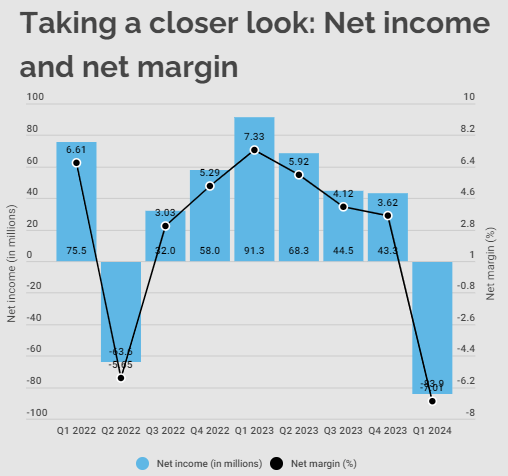
Author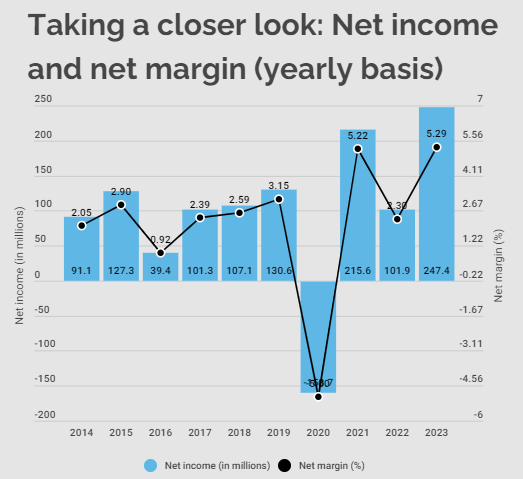
On an annual basis, we can observe an increasing trend with regard to net margin in the post-pandemic period. We have to put into perspective that the year 2022, as well as the first quarter of 2024, presented a reduction in net profit due to early debt repurchases and issuances at lower rates. Therefore, excluding the effects that these expenses had on net profit, we confirm the growth trend in net profit after the pandemic.
Let’s move on to the next part of the analysis. The most important section when we talk about the result in operational practice. Of course, one is inseparable from the other, but I usually present the developments in operations first so that we can understand how profitability is performing as it is.
Profitability
Any and all profitability analysis aims to measure the return on the capital invested by the company. Therefore, we will use some metrics to evaluate Bloomin’ performance in generating resources from its operational activities. Remembering that profitability on debt and the impacts of debt (leverage analysis) have already been detailed in the first chapter of this analysis. To add the concept of opportunity cost to our profitability analysis, I am also thinking about using the EVA Model and measuring the value created by Bloomin’ based on a reference rate.
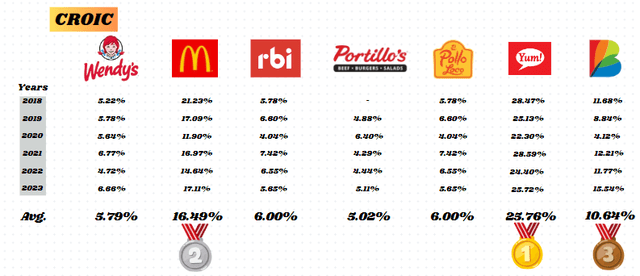
Firstly, we will measure the return on capital in the form of operating cash flow from invested capital. This is CROIC, and it can give us some insights that go far beyond ROA analysis. The latter does not consider the cash generation capacity, in addition to being net of non-monetary operating expenses, such as depreciation and other significant items. And of course, let’s put it in perspective with other companies:
Compared to the restaurant industry, Bloomin’ is an above-average cash generator. An average CROIC of 10.64% indicates that for every dollar invested as an asset, Bloomin’ generates approximately $0.10 in operating cash flow. Don’t forget what I said about the effects of non-operating expenses incurred in 2022. If we exclude these effects, we can clearly infer that after 2020 Bloomin’ started to present higher and more stable returns in the form of cash flow operational. We have to put it in perspective that it was from 2021 onwards that the company began to implement a series of processes that would improve operational efficiency, including the Joey unit model, which was one of the catalysts for this paradigm shift.
Another thing I would like to discuss here before other profitability models is that old paradigm of retention x distribution. As we saw that there was a drop in revenue during the first quarter of 2024, we tend to ask ourselves – are the responsiveness on asset investments still being as profitable as they once were? If not, perhaps we should increase the dividends distributed? I say this because we already know that from 2021 to 2023 we observed a certain growth in CROIC, which indicates a greater generation of operational cash flow from total investment in the form of assets. Let’s see how this responsiveness is working and analyze whether the company should continue investing in its new unit model for expansion:
Author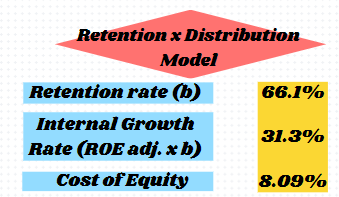
The Internal Growth Rate, which I calculated by multiplying Bloomin’ retention rate with the adjusted ROE, indicates that yes, there is a satisfactory growth potential for Bloomin’ from retention and new investments. But why did I address this here right after the CROIC analysis? Due to the need to generate operational cash flow and measure economic risk. These factors will always be interconnected in reinvestment decisions, as they imply that the company has a certain capacity to remunerate the explicit cost of third-party capital and still reinvest its operating cash flow.
As the value of a share (according to the Solomon-Durand theory) is intrinsically linked to its dividend policy, as the shareholder recognizes the difference between dividends and retained earnings, aware of the inherent risk of the latter, I consider that Bloomin’ does not should underestimate the effects of a stable dividend policy, but rather take advantage of strategic opportunities for investments in profitable assets. And when I say profitable, I really value the equal weighting of the company’s financial management regarding the sale of units in Brazil and the closures of less profitable assets that we saw in 2023.
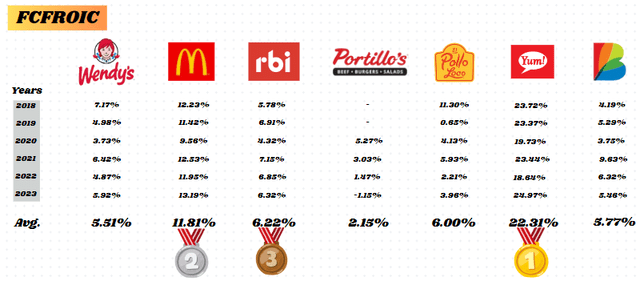
Returning to our profitability analysis, let’s explore FCFROIC. Metric that seeks to establish how much the company is capable of generating free cash flow from invested capital. Remembering that due to the need for greater investments by less mature companies, this metric will benefit mature companies based on the criteria we are applying:
See that although Bloomin’ is the third best company when it comes to generating operating cash flow, it is fifth when it comes to generating free cash flow. This is due to the high amounts of capital spent on investment and financing activities. Even with a stronger operating cash flow from 2021 onwards, there was a greater expenditure when it came to investments and financing.
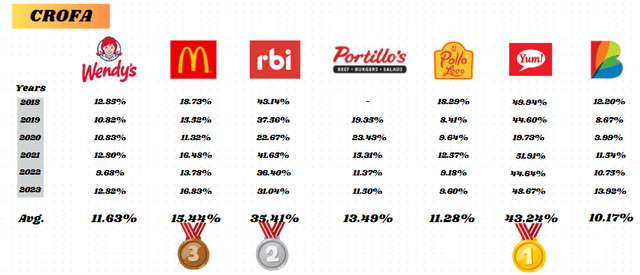
Returning to profitability on fixed assets, we will measure the return on the form of operating cash flow from gross fixed assets, known as CROFA:
Now I would like to talk about Bloomin’ creation of value. Assuming that the company’s objective is to provide, in its investment decisions, a return that remunerates shareholders’ income expectations, the return on the total investment when compared with the opportunity cost (here we can use the risk-free rate , the weighted cost of capital or other bases of comparison) shows how much value the company is creating from this defined element. It is obvious that, for the company to maintain a high market value, it is necessary to constantly create value above other investment alternatives in the market. Hence the importance of opportunity cost and value creation. For the EVA model I designed, I used the risk book rate as an opportunity cost:
Naturally, there are two types of variables that surround value creation in general. The first is ROIC, in the form of return on total investment. This includes the net result and the total value of assets invested by the company. Therefore, an increase in net income with the total investment made by the company remaining stable, the greater the return on invested capital. In other words, this variable is the result of all the company’s activity within a corresponding fiscal year, covering both the investment and financing areas (after all, net profit, as the name suggests, is net of the payment of interest on capital from third parties, for example). Now, the other variable is opportunity cost. It is an uncontrollable and exogenous variable. In other words, no matter how hard the company tries, it can do nothing to change the opportunity cost, only overcome it through a higher return.
We can infer that Bloomin’ generally offers returns above the average risk-free rate for each year. I say generally because the company “destroyed” economic value in 2016 and 2020. Furthermore, we have to remember the impacts of the debt repurchase in 2022, which culminated in both profitability and the creation of a value lower than desired. The average for Bloomin’ is creating almost 1% of value created above the risk-free rate per year. To be fair, it appears that this value increased after the pandemic and measures aimed at profitability. The average counting from 2021 to 2023 was 2.8%. Compared with other companies (counting from 2021) we have Wendy’s with 0.91%, Portillo’s with -3.15% (destroying economic value) and Texas Roadhouse with 7.66%. Therefore, it is not a bad result in the medium term, without a doubt. Perhaps you are in the second or third quartile of the industry when we talk about value creation.
Valuation
Let’s start our valuation section differently today. I would like us to start from the Gordon Model, since Bloomin’ pays quarterly dividends. As you may already know, the Gordon Model assumes that there will be a perpetual increase in the dividend growth rate annually. See, there are two distinct presumptions here. The first is that dividends will be paid in perpetuity. And this may not be true, since there is a need to retain more profits to maintain the integrity of the business activity. The second presumption is that dividends will grow at a certain perpetual growth rate, that is, they will grow ad aeternum from a specified rate.
Invariably accepting the first assumption and determining 29.72% as the perpetual growth rate of this dividend (average year-over-year growth of Bloomin’ dividends over the last five years), it is time to adjust the other variables. The projected dividend for fiscal year 2024 is $0.96 and the weighted average cost of capital for Bloomin’ is 7.65%. Below I exemplified the Gordon Model for Bloomin’ using the aforementioned assumptions:
Author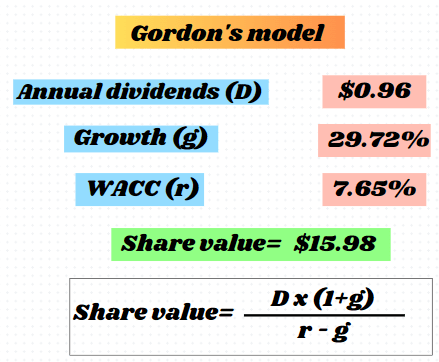
Other interesting models, especially for value investors, that we can use to assess the intrinsic value of Bloomin’ Brands are the Benjamin Graham Model and the Peter Lynch Model. Below are the models already using Bloomin’ data:
Author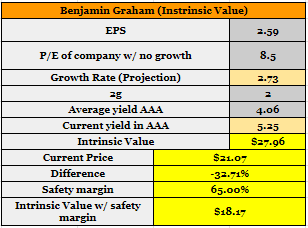
Author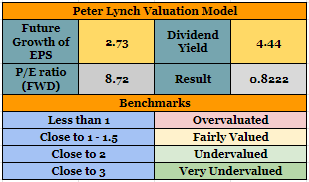
Note that while the Lynch Model shows that Bloomin is slightly overvalued, mainly due to the assumption of growth for EPS (we use EPS Diluted Growth). Note that all growth metrics observed by Seeking Alpha’s Quant indicate a Growth Rate of D-. Note that when we use the same growth assumption in the Graham Model and apply a margin of safety, we also find signs of overvaluation. Let’s see from DCF:
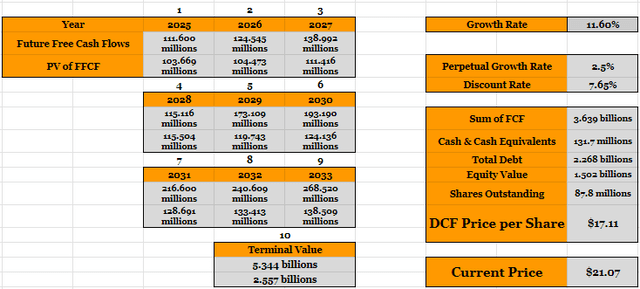
For the DCF I used the same assumptions about the weighted cost of capital used by the company. For Free Cash Flow I used the projection for the end of fiscal year 2024, which is $100 million. And for the growth of Free Cash Flow I used a constant rate of 11.60% taking into account a lower expenditure on investment and financing activities, since most of its most pressing obligations were repurchased in the first quarter of 2024. See that We also found signs of Bloomin’ being overvalued, or at least that the stock is within the range that we would consider fairly priced.
Given the valuation models, I would like to make some observations. Initially, looking at the share’s performance so far, we note a performance of just under 4% appreciation in the value of the share. What would make a value investor hold Bloomin’ shares for the long term if there are no signs of share appreciation in the long term? Certainly a good dividend and profit distribution policy. Of course yes, there is plenty of room for growth and reinvestment in assets within the business, but it seems that these growth opportunities are not materializing as a tangible opportunity in the market, given the anomie with which Bloomin’ is priced.
But notice that even when we make exaggerated assumptions, like when we assume that dividends will continue uninterrupted or that they will grow at an accelerated rate, we still see signs of overpricing. Being very clear, I don’t see room for purchase above $20 taking into account the company’s current growth estimates (for value investors).
Conclusion
We have reached the end of the analysis. Now it’s rating time! Based on all the data we have analyzed so far, I will leave my “Hold” recommendation for Bloomin’ Brands. But what were the reasons for this? Let’s recap and clarify some points.
Bloomin’ Brands has an impressive portfolio of brands, each of which has an advantageous position, with PoDs that help differentiate it within the segment. However, I still have some concerns at the management level. The first are operations in Brazil. As I said previously, Bloomin’ is studying the sale of these operations to the franchise model, as it does with the majority of its International segment (excluding Brazil). Will it be worth selling this segment that is experiencing rapid growth and that did not close any units during the 2023 fiscal year? I mean, even if Bloomin’ does good business and sells it to partners who will execute the operations with excellence. Sales in the United States segment grow at a slow speed. Will it be worth clearing these operations? I can’t say this clearly, although I understand the reasons why Bloomin’ is studying this option. After all, the Brazilian tax system is a real mess.
I am sympathetic to management’s decisions regarding the development of processes that increase operational efficiency. The Joey units and the menu reduction were really efforts that, combined with a more accommodative scenario for agricultural commodities, reduced food and beverage costs. I still worry about the cost of work and how wage inflation will behave during this year. A higher scenario of operating expenses, with greater investment in advertising, while the promotional environment begins to emerge for the casual dining segment, also makes me believe in more timid operational results.
Structurally, I don’t see debt as that big of a problem for Bloomin’. We saw that even with some level of Financial Risk, the company does not incur Economic Risk, which would be disastrous. Debt indicators do not indicate any pressing problems. The cycles are well formatted with the Fleuriet Model indicating that the company is capable of mobilizing current resources, as it willingly uses commercial credit and maintains its cash flow optimized based on a short operating cycle and long payment terms.
Now, when we talk about profitability, Bloomin’ leaves something to be desired. Note that despite an above-average CROIC, the company has a low FCFROIC and CROFA. This indicates that it still has a great need for investment and financing that sucks the return on capital from the operating cash flow, reducing its free cash flow and that it does not have a satisfactory return on its fixed assets. I know the company is already moving to resolve this, but the problem is that these two points cannot be resolved at once. The remodeling and closing of unprofitable units that the company carried out in 2023 is a step towards improving CROFA, which in the long term, based on the maturation of new, more profitable units, will form a healthy FCFROIC. Therefore, I still see a window of time until the company achieves this result.
Furthermore, I see space for purchases between $18 and $19.50, up to $20 for the more daring. The pricing models gave us an idea that the share is close to fair value given the growth assumptions, which are low.
I hope you enjoyed this analysis. Don’t forget to comment if you prefer me to explain some more advanced concepts that I used here again, during all the analyses, or just mark a past article in which I explained it in more depth and give you a sign of where to find it. Thanks!

