Gary Yeowell
The John Hancock Financial Opportunities Fund (NYSE:BTO) is a closed-end fund that invests primarily in the banking sector of the economy. This is not exactly the most popular sector right now, as banks are generally perceived to deliver better performance during periods of low interest rates. However, historically, this is not exactly correct. This chart shows the net interest margin of U.S. banks over the 2000 to 2021 period (unfortunately, more recent data is not available from either the World Bank or the Federal Reserve):
Federal Reserve Bank of St. Louis/World Bank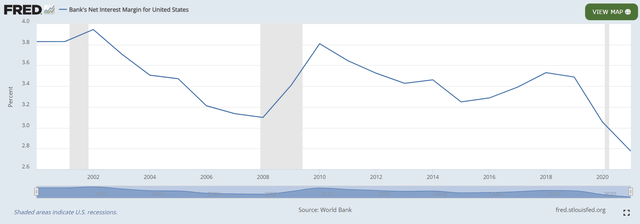
It is difficult to see a negative correlation between interest rates and net interest margin. After all, interest rates in 2000 were at higher levels than they are today, but net interest margins were at the highest levels that were seen at any time during the 21st century. We also see net interest margins rising over the 2016 to 2019 period, which also saw the Federal Reserve slowly raising interest rates from all-time lows. Then, we also see the net interest margin hit a two-decade low in 2021 despite interest rates being basically zero.
Indeed, if anything, this chart seems to suggest that there is either no correlation between net interest margins and prevailing interest rates or that banks are actually more profitable when interest rates are high. The sole exception to this rule is the 2008 to 2010 period, which saw a surge in net interest margins but a rapid decline in interest rates.
The Federal Deposit Insurance Commission confirms in a 2021 report that high short-term interest rates are not bad for banks:
Developments since the Great Recession generally support the idea that protracted periods of low interest rates tend to compress net interest margin at FDIC-insured institutions. NIM decreased during the period of historically low interest rates after that recession, increased during the upward rate cycle between 2015 and 2019, and decreased again as interest rates fell towards zero with the onset of the COVID-19 pandemic.
Thus, there is no real reason to avoid the John Hancock Financial Opportunities Fund just because it invests in the banking sector. There are, of course, a few problems within the banking sector, but they mostly revolve around a handful of banks that made loans to marginal borrowers who cannot afford to make payments on the loans in today’s higher interest rate environment. In short, the problems that the media have been discussing in the banking sector are an underwriting problem, not an interest rate problem. Presumably, an actively managed fund like the John Hancock Financial Opportunities Fund would be able to steer clear of those problem banks, but this is not certain, and we will want to pay special attention to the fund’s holdings as a result.
As is the case with most closed-end funds, the John Hancock Financial Opportunities Fund is fairly attractive for those investors who are seeking income. As of the time of writing, the fund boasts a 9.33% yield, which is certainly very attractive compared to the broader equity indices:
The fund has very few direct peers, but there are a number of funds that focus their efforts on only a single sector of the economy. The John Hancock Financial Opportunities Fund has a very attractive yield compared to most of these:
Fund Name | Morningstar Classification | Current Yield |
John Hancock Financial Opportunities Fund | Equity-Sector Equity | 9.33% |
Adams Natural Resources Fund (PEO) | Equity-Sector Equity | 5.87% |
BlackRock Health Sciences Trust (BME) | Equity-Sector Equity | 6.32% |
Cohen & Steers Infrastructure Fund (UTF) | Equity-Sector Equity | 7.93% |
First Trust Specialty Finance and Financial Opportunities Fund (FGB) | Equity-Sector Equity | 10.28% |
Reaves Utility Income Trust (UTG) | Equity-Sector Equity | 8.07% |
As we can see, the only fund shown here that comes anywhere close to the yield of the John Hancock Financial Opportunities Fund is the First Trust Specialty Finance & Financial Opportunities Fund.
At first glance, this would also appear to be the closest direct peer because both funds invest in financial companies. However, the First Trust Specialty Finance & Financial Opportunities Fund invests primarily in business development companies, which are a very different animal than the banks that are represented in the John Hancock Financial Opportunities Fund. In particular, business development companies tend to have substantially higher yields than banks and pay out most or all of their profits to the shareholders (most domestic banks do not). Business development companies are also somewhat more sensitive to interest rates and do not have the same level of support from governments that banks do, so they are somewhat riskier companies.
Overall, we can see that the John Hancock Financial Opportunities Fund has a very high current yield for a sector-specific fund, and this might be partly due to the market’s current fearful attitude towards the banking sector in general.
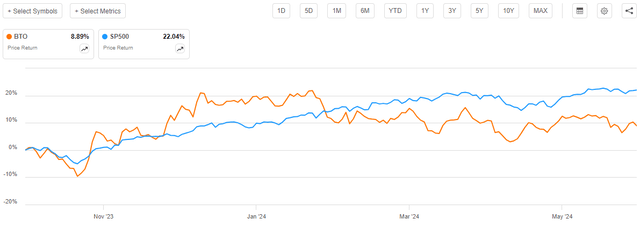
As regular readers might remember, we previously discussed the John Hancock Financial Opportunities Fund in October 2023. The market in general was very fearful at that time, but it has since rebounded on hopes that interest rate cuts will soon be on the horizon. That has driven up stocks of many companies to incredibly high levels, and banks have not been ignored in the rally. As such, we might expect that the John Hancock Financial Opportunities Fund has also delivered a very attractive return since that article was published. This is indeed the case, as shares of the fund have risen by 8.89% since that previous article was published. While this is not bad, especially since only eight months have passed, the fund has significantly underperformed the S&P 500 Index (SP500) as a whole:
This is something that many investors will not be happy to see. After all, who wants to underperform the market by such a large degree? However, there are certainly some investors who prioritize income enough that they might be willing to accept underperformance in exchange for a higher yield.
However, the fund’s share price performance does not tell the whole story. As I explained in a previous article:
A simple look at a closed-end fund’s price performance does not necessarily provide an accurate picture of how investors in the fund did during a given period. This is because these funds tend to pay out all of their net investment profits to the shareholders, rather than relying on the capital appreciation of their share price to provide a return. This is the reason why the yields of these funds tend to be much higher than the yield of index funds or most other market assets.
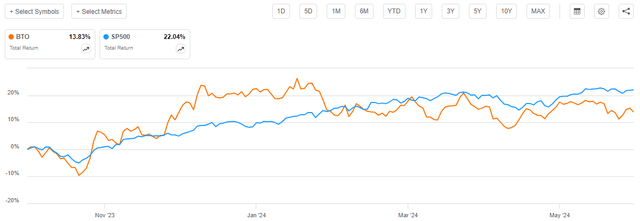
When we include the distributions that were paid out by the John Hancock Financial Opportunities Fund in the chart above, we get this alternative chart that actually reflects how shareholders in this fund did over the intervening period:
As we can quickly see, shareholders of the John Hancock Financial Opportunities Fund actually realized a 13.83% total return since my previous article on this fund was published. This is still much less than the S&P 500 Index delivered over the period, but it is not a return that will be completely unacceptable to many investors.
As eight months have passed since we last discussed the John Hancock Financial Opportunities Fund, it is logical to assume that many things have changed. The remainder of this article will focus specifically on these changes and attempt to determine whether it makes sense to purchase shares of the fund today.
About The Fund
According to the fund’s website, the John Hancock Financial Opportunities Fund has the primary objective of providing its investors with a high level of capital appreciation and current income. The website goes on to state that the fund will attempt to achieve this by investing at least 80% of its assets into equity securities issued by American and foreign banks:
John Hancock Investments
As might be assumed, the term “equity securities” in this case refers specifically to common stock. The fund’s first quarter 2024 holdings report states that the John Hancock Financial Opportunities Fund had the following asset allocation on March 31, 2024:
Asset Type | % of Total Assets |
Common Stocks | 91.1% |
Preferred Stocks | 5.2% |
Corporate Bonds | 2.4% |
Convertible Bonds | 1.1% |
Certificates of Deposit | 0.0% |
Money Market Fund | 0.3% |
We can see a surprisingly large allocation to preferred stock here, but I suppose that is not exactly unexpected for a fund that invests primarily in the banking sector. After all, banks are the largest issuers of preferred stock in the capital markets. I explained this in a previous article (linked earlier):
The first thing that we notice here is that all of the companies in the fund’s largest positions list are either utilities or banks. This is not uncommon for a preferred stock fund because banks and utilities are the largest issuers of preferred stock in the market. As a result, almost any preferred stock fund will be very heavily weighted towards these two types of companies. With that said though, usually the overwhelming majority of companies in the top ten list are banks. This is due to international banking regulations that require banks to hold a certain percentage of their assets in the form of Tier one capital. Tier One capital refers to that proportion of a bank’s assets that are not simultaneously a liability to somebody else (such as a depositor). When regulators require that a bank increase its Tier One capital, its only options are to issue either common or preferred stock. The bank will often choose to issue the preferred stock in order to avoid diluting the common stockholders.
That particular passage was included in an article about one of John Hancock’s preferred stock funds, but it does a good job of explaining why banks are the largest issuers of preferred stock in the capital markets. While the John Hancock Financial Opportunities Fund invests primarily in common stock, it does make sense that the fund would include a certain amount of banking sector preferred stock. After all, the fund does have current income as one of its stated objectives.
Preferred stock tends to have a higher yield than common stock issued by the same company, so the presence of preferred securities should boost the fund’s income somewhat from what it would have had with an all-common stock portfolio. In addition, preferred stock is usually less volatile than common stock. Thus, the fund’s inclusion of these securities should prevent the fund’s net asset value from bouncing around as much as it otherwise would. This is something that might be important given the fund’s managed distribution policy, which we will discuss later in this report.
The fact that the John Hancock Financial Opportunities Fund invests primarily in common stock works pretty well with its objectives of capital appreciation and current income. After all, common stock in general delivers a significant portion of its investment returns in the form of capital gains. The banking sector also tends to have somewhat higher yields than many other sectors, as indicated by the fact that the iShares Global Financials ETF (IXG) has a trailing twelve-month distribution yield of 2.45%. That is higher than the 1.38% yield of the S&P 500 Index and the 1.72% yield of the MSCI All-Countries World Index (ACWI). European banks have even higher yields, as the iShares MSCI Europe Financials ETF (EUFN) yields 4.39% at the current price. For this reason, banks are a pretty good place to park money if an investor is looking for both capital appreciation potential and current income. That is precisely what the John Hancock Financial Opportunities Fund is trying to do.
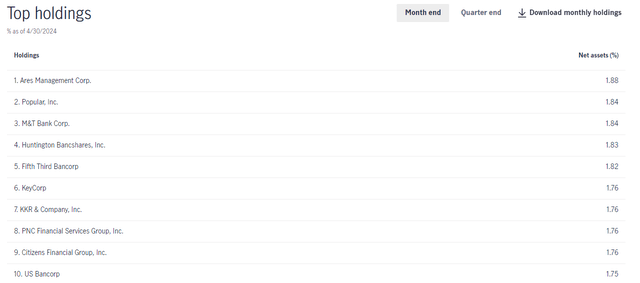
The fund’s website explicitly states that the John Hancock Financial Opportunities Fund invests in both domestic and foreign banks. However, its largest positions list right now is dominated by American financial firms:
Everything that is currently on this list is an American financial institution, although they are not all banks. There might be some readers who question Popular’s (BPOP) status as an American bank though, since Popular, Inc. is actually a division of Banco Popular de Puerto Rico, which is one of the largest banks in Puerto Rico. Puerto Rico is an American territory, so that company is actually American, even though it does not have a headquarters in any U.S. state. This focus on the financial sector of the United States is apparent over the remainder of the portfolio and not just the top ten holdings list.
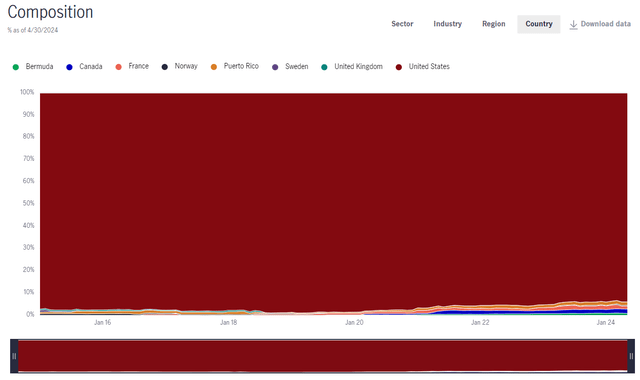
The fund’s website states that 93.95% of the fund’s holdings as of April 30, 2024, are American companies. It also states that another 1.52% of its assets are invested in companies based in Puerto Rico, which also counts as American. That brings us to a total of 95.47% of the fund’s assets that are invested in the United States or its territories on April 30, 2024. This outsized focus on the United States has been a recurring theme for this fund, as we can see here:
This chart shows the fund’s country weighting on a monthly basis going back to December 2014. As we can immediately see, the United States has accounted for more than 90% of the fund’s assets during every single month over the period. Indeed, if we are considering Puerto Rico to be part of the United States (which it is) then the U.S. weighting has not been less than 94% over the entire period. Given this, it is very difficult to understand why the website even bothers to state that the fund invests in both American and foreign financial institutions. The foreign exposure appears to be more of an afterthought than an actual reason to invest in the fund.
Overall, there are much better ways to obtain foreign financial sector exposure than this fund, and American investors who are looking to obtain some foreign exposure should look elsewhere. Fortunately, the high exposure to the United States does mean that there is only a single monetary regime that we need to worry about when predicting the fund’s performance going forward.
The financial media has been screaming about problems in the financial sector due to “high interest rates.” However, as we saw in the introduction, high interest rates do not in and of themselves hurt banks. Indeed, the data from the Federal Reserve, the World Bank, and the Federal Deposit Insurance Corporation all point to higher interest rates being good for banks because it increases their net interest margins. However, there is still one problem in the banking sector that was directly caused by the Federal Reserve’s interest rate hiking cycle. This problem is unrealized losses that came about because bond prices decline when interest rates rise. Business Insider explains this in a report from yesterday:
According to the Federal Deposit Insurance Corporation’s first quarter report, the US banking system is sitting on a collective $517 billion in unrealized losses and has 63 problem banks.
These losses have been sparked primarily by a surge in interest rates over the past two years, which have driven down the price of fixed-income securities held by banks.
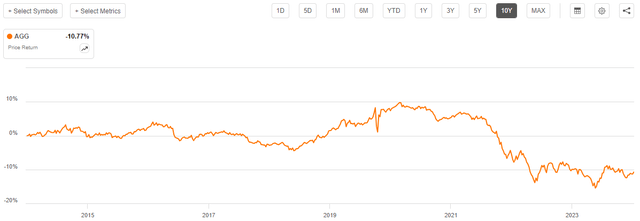
In short, banks made many loans over the past ten or fifteen years at fixed interest rates. Interest rates at the time were much lower than they are today, and so all of these loans are worth less today than they were a few years ago. It is the same reason that the Bloomberg U.S. Aggregate Bond Index (AGG) is down 10.77% over the past ten years:
This could pose a problem if a given bank’s depositors wish to withdraw their money all at once. That would force the bank to have to sell the bonds and fixed-rate loans and realize those losses. This is what brought down Silicon Valley Bank last year (the “toxic securities” in that case were ten-year U.S. Treasuries). Apart from some areas of the commercial mortgage sector, though, we are not seeing widespread defaults.
This is not a situation like what occurred in 2007 where the loans themselves went bad. Thus, as long as the banks do not need to conduct a fire sale and realize the losses, then things should be okay. This is why it is important to keep an eye on the specific banks that the fund has chosen to invest in. There is nothing in its top ten list that looks to be problematic and in any case, the fund does not have a significant amount of exposure to any individual bank. Thus, for now, investors in this fund should not need to worry too much about commercial mortgage risk or high-interest rates in the banking sector.
Leverage
As is the case with most closed-end funds, the John Hancock Financial Opportunities Fund employs leverage as a method of increasing the effective yield and total return that it earns from the assets in its portfolio. I explained how this works in the previous article on this fund:
In short, the fund borrows money and then uses that borrowed money to purchase securities issued by banks and other financial institutions. As long as the total return that the fund receives from the purchased assets is higher than the interest rate that it has to pay on the borrowed money, the strategy works pretty well to boost the effective total return of the portfolio. This fund is capable of borrowing money at institutional rates, which are considerably lower than retail rates. As such, this will usually be the case.
However, the use of debt in this fashion is a double-edged sword. This is because leverage boosts both gains and losses. As such, we want to ensure that the fund is not employing too much debt, as that would expose us to an unacceptable amount of risk. I generally do not like a fund’s leverage to exceed a third as a percentage of its assets for this reason.
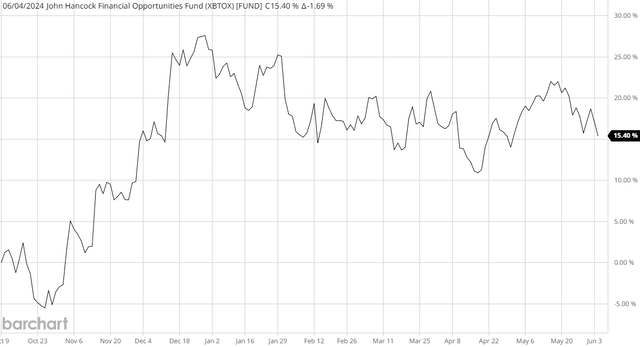
As of the time of writing, the John Hancock Financial Opportunities Fund has levered assets comprising 18.64% of its portfolio. This is a reasonable level of leverage that is quite a bit lower than the 20.79% leverage that it had the last time that we discussed the fund. It is not surprising that the fund’s leverage ratio declined over the period. After all, we saw in the introduction that the fund’s share price went up since our last discussion. The fund’s net asset value also went up, to a much larger degree:
As we can clearly see, the fund’s net asset value increased by 15.40% since the last time that we discussed this. This is a far better performance than the fund’s share price managed to deliver over the period, which could have some implications for its valuation. We will discuss that later in this article. The fact that the fund’s portfolio grew means that its borrowed assets should represent a smaller percentage of the portfolio, all else being equal. This is precisely what we see in the leverage ratio decline.
We can clearly see that the leverage of the John Hancock Financial Opportunities Fund is well below the one-third of assets levels that we would ordinarily deem acceptable for an equity closed-end fund. However, let us compare it to that of its peers to make sure that it is not unnecessarily risky compared to other funds:
Fund Name | Leverage Ratio |
John Hancock Financial Opportunities Fund | 18.64% |
Adams Natural Resources Fund | 0.00% |
BlackRock Health Sciences Trust | 0.00% |
Cohen & Steers Infrastructure Fund | 30.00% |
First Trust Specialty Finance & Financial Opportunities Fund | 11.99% |
Reaves Utility Income Trust | 20.93% |
(all figures from CEF Data.)
This is certainly interesting. We can immediately see that a few of the fund’s peers do not use any leverage. In the case of the Adams Natural Resources Fund, that is certainly understandable, as that fund has a great deal of exposure to crude oil and leverage has gotten many other traditional energy funds into trouble over the past ten years. That is due to the inherent volatility of commodity prices. When simply compared to those funds that do employ leverage as a part of their strategy, the John Hancock Financial Opportunities Fund does not appear to be particularly indebted.
Thus, overall, we probably do not need to worry too much about this fund’s use of leverage right now. It appears that it is striking a reasonable balance between risk and reward.
Distribution Analysis
As mentioned earlier, the primary objectives of the John Hancock Financial Opportunities Fund are to provide its investors with a high level of capital appreciation and current income. To that end, the fund pays a quarterly distribution of $0.65 per share ($2.60 per share annually). This gives the fund an impressive 9.33% yield at the current share price.
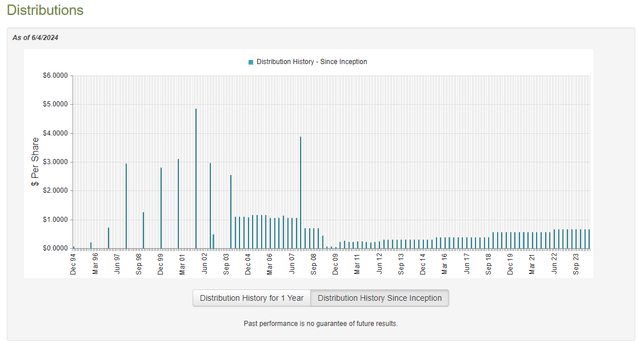
Unfortunately, the fund has not been particularly consistent regarding its distributions over the years:
As I stated in the previous article:
As we can see, the fund’s distribution has varied quite a bit over the years, although it has generally been increasing since the financial crisis sixteen years ago. For the most part, this distribution history might appeal to anyone who is seeking a safe and secure source of income to use to pay their bills or finance their lifestyles. However, the fact that this fund only pays its distribution quarterly, as opposed to monthly, might reduce its appeal somewhat. It certainly slows down the rate of compounding for those investors who are actively trying to build their wealth, which is unfortunate. However, a quarterly distribution can still be acceptable for people trying to live off the income generated by their portfolios, it simply requires a bit more discipline.
We also see that the fund’s distribution has been increasing over the past several years. The market itself has been much choppier than this, especially since the pandemic. It therefore might be difficult to see how the fund can be so consistent with its distribution when the market itself is not. The solution to this problem comes from the fact that the John Hancock Financial Opportunities Fund employs a managed distribution. The fund’s most recent annual report explains how this works:
The Fund has adopted a managed distribution plan. Under the Plan, the fund currently makes quarterly distributions of an amount equal to $0.6500 per share, which will be paid quarterly until further notice. The Fund may make additional distributions: (i) for purposes of not incurring federal income tax at the fund level of investment company taxable income and net capital gain, if any, not included in such regular distributions; and (ii) for purposes of not incurring federal excise tax on ordinary income and capital gain net income, if any, not included in such regular distributions.
This states that the fund will pay $0.65 per share quarterly, regardless of what it actually manages to earn from its investment portfolio. Obviously, this may result in the fund distributing more than it earns and thus destroying its net asset value. That could prove problematic over extended periods, since the fund will eventually be unable to generate sufficient investment profits to maintain its distribution. As such, we should take a look at the fund’s finances to determine how well it is covering its distributions.
As of the time of writing, the fund’s most recent financial report is the annual report that corresponds to the full-year period that ended on December 31, 2023. This is a newer report than the one that we had available to us the last time that we discussed this fund, which should make it work pretty well as an update.
For the full-year period that ended on December 31, 2023, the John Hancock Financial Opportunities Fund received $23,327,361 in dividends along with $819,973 in interest from the assets in its portfolio. We subtract the money that the fund had to pay in foreign withholding taxes, which gives us a total investment income of $24,045,875 for the full-year period. The fund paid its expenses out of this amount, which left it with $8,273,939 available for shareholders. That was not sufficient to cover the $50,807,042 that the fund paid out in distributions during the period.
The fund was unable to make up the difference through capital gains. For the full-year period, it reported net realized gains of $37,833,433. The net realized gains were almost entirely offset by $37,420,582 net unrealized losses. Overall, the fund’s net assets declined by $30,377,415 after accounting for all inflows and outflows during the period.
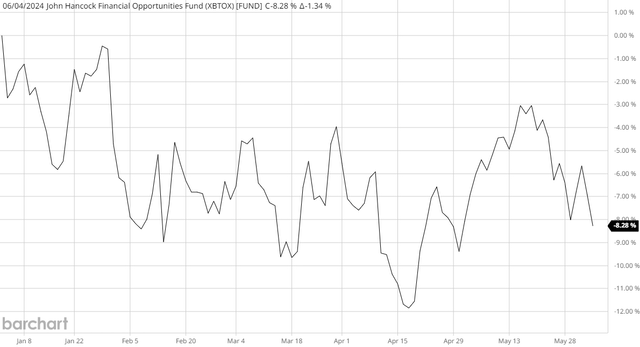
Thus, we can immediately see that the fund failed to cover its distributions over the course of 2023. This has continued to be the case so far in the current 2024 fiscal year. Here is the fund’s net asset value since the start of this year:
As we can see, the fund’s net asset value has declined by 8.28% since the start of this year. That means that the fund has been paying out more than it has been able to earn from the portfolio. Thus, the distributions are destroying the portfolio’s total value. This is something that needs to be corrected quickly, or the fund will almost certainly need to cut its payout.
Valuation
Shares of the John Hancock Financial Opportunities Fund are currently trading at net asset value. This is quite a bit more expensive than the 1.55% discount that shares of this fund have averaged over the past month. Thus, potential investors can probably get a better price if they wait a bit before buying shares.
Conclusion
In conclusion, the John Hancock Financial Opportunities Fund is one of the few closed-end funds that invests exclusively in the banking sector. This sector is not nearly as risky as some readers might think, as most of the problems are being caused by bonds decreasing in price and not insufficient profitability across the banking sector.
The biggest risk with this fund right now is that it seems to be struggling to maintain its distribution and could be forced to reduce its payout in the near future if it wishes to keep its net asset value intact. The current yield is pretty attractive though and the shares no longer trade at a huge premium like they did back in October 2023. I still think that caution is in order here, though.
Editor’s Note: This article discusses one or more securities that do not trade on a major U.S. exchange. Please be aware of the risks associated with these stocks.


