anyaberkut
At the beginning of the year – in mid-January 2024 – I published my last article about Graco, Inc. (NYSE:GGG) and in these almost five months the stock first increased to an all-time high of $94.77 and then started declining again and is now trading about 16.5% below that all-time high. Compared to my last article the stock lost about 5% in value while the S&P 500 increased 13% in the same timeframe.

And till mid-March, Graco performed more or less in line with the S&P 500 (SPY) but at the end of April – following first quarter results – the performance of Graco drifted apart. This discrepancy probably had to do with the disappointing first quarter results, but it might also be a harbinger of what is about to come. In the following article we will take another look at Graco and explain why we could still see the stock as fairly valued but also why we should stay cautious.
Predictions From January 2024
In my last article in January, I made it clear that Graco is a bit too expensive, and I made some predictions and outlined two challenges that might lead to lower stock prices. In the article I wrote:
“Although I see Graco as a high-quality business with a wide economic moat around the business, I would be cautious right now as Graco investors are facing two challenges – and these two challenges combined have the potential to tank the stock price once again:
- Based on the expectations of a recession (or depression) and probably a struggling housing market, we can expect lower earnings per share in the coming quarters. Graco will most likely see lower revenue and margins will also decline.
- Additionally, investors will get more cautious (or even panic) as they do in almost every recession. This usually leads to lower valuation multiples investors ascribe to most stocks. Investors expect lower growth rates as well as trouble ahead and in such a scenario almost nobody is willing to pay 25 or 30 times earnings for a stock.”
And a 5% decline compared to my last article is not a lot, but we could look at the two points made in the article – valuation and fundamentals – again. Let’s start with fundamentals and the last quarter results.
Quarterly Results
I already mentioned above that investors were rather disappointed with first quarter results, Graco reported on April 24, 2024. For starters, Graco missed expectations on revenue as well as earnings per share. And while Graco missed $0.09 on earnings per share estimates, it missed revenue expectations by $43 million.
Graco Q1/24 Conference Call Slides
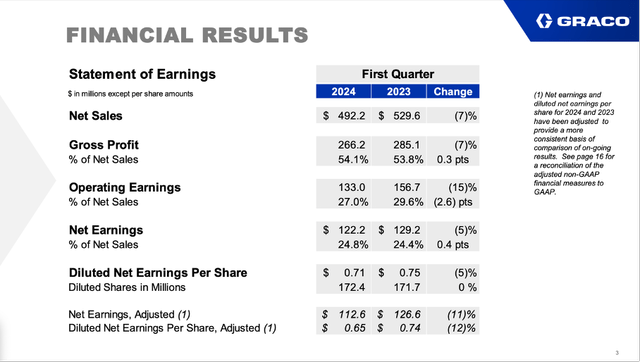
Net sales declined from $529.7 million in Q1/23 to $492.2 million in Q1/24 – resulting in 7.1% year-over-year decline. Operating earnings also declined 15.1% year-over-year from $156.7 million in the same quarter last year to $133.0 million this quarter. And diluted earnings per share also declined from $0.75 in Q1/23 to $0.71 in Q1/24 – resulting in 5.3% year-over-year decline. Adjusted earnings per share declined even 12.2% year-over-year from $0.74 in Q1/23 to $0.65 in Q1/24. Finally, free cash flow increased from $52.5 million in the same quarter last year to $81.7 million this quarter – resulting in 55.6% year-over-year growth. And while gross margin still increased 30 basis points, operating margin declined 260 basis points.
Graco Q1/24 Conference Call Slides
When looking at the segment results, all three segments had to report declining sales. In the contractor segment sales were down 6% to $230 million and management is pointing out that sales were heavily impacted by the timing of the new product releases in North America, which will primarily be in the second quarter.
In the Industrial Segment sales declined 5% to $142.0 million and here especially the weakness in the Asia-Pacific construction market (we will get to this again) were one of the reasons for the decline. On the other hand, powder coating systems sales were strong, but not enough to offset the declines.
And finally, the Process segment also had to report declining sales. In this case sales declined 10.0% to $120.2 million. This segment reported high growth rates in the recent past, but now the decline in both semiconductors and process transfer equipment sales had a huge negative impact that was not offset by growth in lubrication business.
Graco Q1/24 Conference Call Slides
And when looking at the different regions, it is especially the Asia-Pacific region that is troublesome. Although the region is responsible for the smaller part of revenue (among the three regions), 16% year-over-year decline is rather steep. During the last earnings call, management commented:
Asia is still pretty weak, in particular. China, as there’s just not as much capital flowing into there. The construction markets have been tough. We are starting to see a little bit of a pickup there in the container industry where they’re starting to build containers again, but that’s not going to be enough to really change the game there. And of course, China is like the big thing for our business. China catches the cold, everyone gets sick. So all in all, I’m probably more optimistic than pessimistic at this point, but we’ll see because we’re not the greatest at forecasting these short-cycle businessses.”
Graco Q1/24 Conference Call Slides
Overall, Graco is expecting growth in the low-single digits, and we see that especially the Asia-Pacific region is continuing to give the company headaches.
Construction and Housing
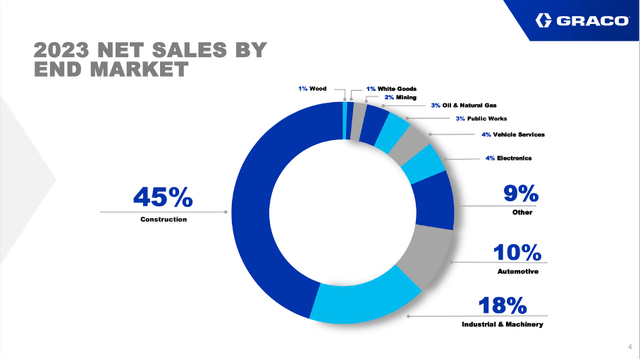
Aside from the focus on the Asia-Pacific region, which is leading to troubles for Graco, it is the housing and construction market we should focus on as the company is generating almost half of its revenue in construction.
Graco Q1/24 Investor Presentation
When looking at the numbers we already see construction being responsible for a lower part of total revenue (implying that construction is declining more than overall revenue). In the last few years, construction was always responsible for 48% to 49% of total revenue. And the numbers above are for fiscal 2023, the numbers for the first quarter 2024 might be even lower. The two segments – Contractor and Industrial – were housing and construction is playing an important role saw organic revenue decline in the mid-single digits and also the operating margin declining.
And as we see in the outlook above, Graco is not so pessimistic for the United States. Instead, it is pessimistic for the Asia-Pacific region (China in particular). But when looking at the metrics I already mentioned in my last article, I don’t see much reason to be optimistic in the United States as the metrics are slowly getting worse.
When looking at the new privately-owned housing units authorized in permit issuing places, we see the numbers continuing to decline in the last few months after the numbers stagnated since late 2022. Of course, we are still above the lows from December 2022 but I expect new lows in the next few months.
We can also look at the new privately-owned housing units under construction and see the numbers now continuing to decline. But we are far away from a steep decline – compared to a high of 1.711 million in October 2022 the number is now 1.616 million.
In my last article I also looked at the employees in construction – here the number is continuing to increase and although growth is slowing down, we still see 3.25% year-over-year increase. And total construction spending is stagnating at a high level. In my opinion we see the first signs for a slowdown in the housing and construction market, but clear signals are missing at this point.
I still expect the United States to be headed for a recession and the declining housing permits are actually one of the early warning indicators to look out for. The yield curve, which was one of the best warning indicators in the past, has already inverted for a long time and is warning us about a potential recession ahead for several quarters now. Another early warning indicator – although not the best – are increasing initial unemployment claims. When looking at the 4-week moving average to level out fluctuations, we see the number slowly increasing since January 2024 from about 200k weekly initial claims to about 223k weekly initial claims. But this is not enough to see it as a sure signal for a recession as we don’t have to go back far to see similar fluctuations – a few years is enough.
Right now, the next “steps” are missing that would clearly indicate a recession. Aside from the initial unemployment claims, the FED lowering rates would also be one of the steps usually happening before (or in the very early phase of) a recession. And although we can raise the question Now, Where Is Your Recession? like I did in November 2023 I still think a recession is the scenario we are headed for.
Valuation
Aside from the fundamental issues that might lead to a lower stock price for Graco, I also talked about lower valuation multiples for Graco as a potential risk. When looking at the valuation multiples, there is not much difference compared to my last article. At the time of writing, Graco is trading for about 27 times earnings per share as well as 27 times free cash flow. And in both cases, this is below the 10-year average valuation multiples – in the last ten years, Graco was trading on average for 32.44 times earnings and 32.48 times free cash flow.

Although Graco is trading slightly below its 10-year average valuation multiples, trading for 27 times earnings and free cash flow certainly is not cheap and can only be justified by high growth rates. However, “high growth rates” is an ambiguous term as this could mean 7% growth, 12% growth or 25% annual growth (and for some, 4-5% growth might even be high as it is usually above GDP growth).
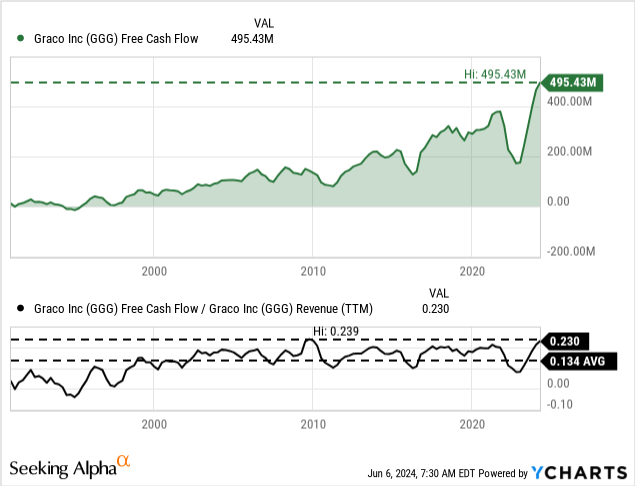
To solve this problem, we often use a discount cash flow calculation to determine an intrinsic value. When taking the free cash flow of the last four quarters, which was $495 million and an all-time high and record, Graco must grow its free cash flow 9% annually for the next decade followed by 6% growth till perpetuity to be fairly valued (trading for $80 per share at this point). This calculation is assuming – as always – a 10% discount rate and we are taking the last reported number of outstanding shares, which was 172.4 million.
Graco Q1/24 Conference Call Slides
And Graco itself has a long-term growth plan of 12% annual bottom line growth. When looking at the last ten years, revenue increased with a CAGR of 7.12% and earnings per share increased with a CAGR of 10.13%. In the last 20 years (since 2003), earnings per share increased with a CAGR of 10.35% and in the last 30 years (since 1993) earnings per share increased with a CAGR of 15.40%. Hence, we can see that growth rates of 12% are possible for Graco, but they should not be seen as a given and as I always stay on the side of caution I would rather calculate with 10% growth.

Aside from 12% growth, we should also be cautious about the trailing twelve months free cash flow as the amount could be an outlier (see chart above). In the last five years, free cash flow was $313 million on average and with 23% of revenue ending up as free cash flow in the last four quarters Graco could report one of the best metrics here since the early 1990s and a metrics clearly above the long-term average (see chart above).
Instead, I would rather calculate with $400 million free cash flow as basis for our calculation. Additionally, we assume 10% growth for the next ten years followed by 6% growth till perpetuity which leads to an intrinsic value of $70.54 for Graco (all other assumptions being the same). In this scenario Graco would be a bit overvalued.
Conclusion
We could argue that Graco is fairly valued at this point and considering the high-quality business and wide economic moat, double digit growth rates over the long run might be achievable.
But I still would be cautious about the years to come for different reasons. On the one side, we can make the argument that Graco is still slightly overvalued right now. On the other hand, and this is far more important than valuation, I see the construction and housing market already struggling and dark clouds on the economic horizon, which will have a huge impact on Graco’s business. Overall, the stock is a “Hold” and investors with a long-term horizon should keep their shares, but I wouldn’t buy or add to the position at this point.


