Lamebert: Yes, that’s right.
Authors: Alessandra Bonfiglioli, Professor of Economics (on leave) at Queen Mary, University of London, Rosario Curino, Professor of Economics at the University of Bergamo, Gino Gancia, Research Fellow in International Trade and Regional Economics, Ioannis Papadakis, Research Fellow at the University of Sussex. Originally published on VoxEU.
Harnessing the potential of artificial intelligence has become one of the top priorities for policymakers around the world. But this requires first a thorough understanding of the impact of these technologies on the labor market. In this column, using data from U.S. commuter zones from 2000 to 2020, we provide evidence that the introduction of AI has led to job losses, except for high-paying occupations and those requiring a degree in a STEM field.
Artificial intelligence (AI) is often considered one of the most transformative and disruptive technologies of recent years (see Baldwin 2018 and early Vox columns by Bughin 2017). Driven by improvements in machine learning techniques and the availability of vast amounts of digital data, the past two decades have seen an exponential increase in the use of AI applications, such as web search engines, targeted advertising, recommendation systems, generative or creative tools, and chatbots. A pressing policy question is how these advances will affect the labor market, and in particular employment. On the one hand, intelligent tools are expected to augment human capabilities and create new demand for certain skills (e.g., Brynjolfsson et al. 2023, McKinsey Global Institute 2017). On the other hand, AI may overtake workers in decision-making tasks, making them redundant or facilitating automation (Acemoglu 2022, Acemoglu and Johnson 2023). Thus, whether AI complements or substitutes workers is an empirical question for which there is as yet little systematic evidence.
A recent study (Bonfiglioli et al. 2023) explored the employment effects of early AI adoption, exploiting differences between US commuter zones (CZs) from 2000 to 2020. If we define AI broadly as algorithms applied to big data, its adoption began in the early 2000s and accelerated after 2010. Although our sample predates the development of large-scale language models such as ChatGPT, it nevertheless covers the rise of the digital economy and all the major companies involved in big data collection, such as Amazon, Google, and Facebook.
Measuring AI Adoption in U.S. Commuting Areas
Our analysis faces two challenges. First, measuring AI adoption is difficult because there are no official statistics to date. But using AI technologies requires workers with very specific programming skills. We leverage a new section of the O*NET database, “Hot Technologies,” to classify as AI-related occupations those occupations for which software used for machine learning and data analysis is most frequently requested in job advertisements. Our baseline classification of AI-related occupations consists of 19 occupations, including data scientists, computer programmers, software developers, and web designers. Second, Introducing AI Given the increasing relative importance of AI-related occupations, AI adoption may be correlated with other shocks that may affect employment. To overcome this issue, we use a shift-share tool. Exposure to AIThis combines U.S. industry-level AI adoption with the CZ-level employment share across industries prior to adoption, allowing us to identify CZs with high AI exposure as those CZs focused on industries with faster growth in AI-related jobs nationally.
Between 2000 and 2020, the employment share of AI-related occupations in the United States nearly doubled, from 0.14% to 0.20%. Most of this increase has occurred since 2010. There are significant differences in the penetration of AI technologies across industries. AI adoption is most prevalent in the service sector, especially in advanced sectors such as information, professional, scientific, and business services. It is also important in some public utilities, such as electricity, and in some areas of the public sector, such as national security and international affairs. Conversely, the adoption of AI in manufacturing is still limited. This characteristic distinguishes AI adoption from the use of industrial robots, which is mainly concentrated in manufacturing (Acemoglu and Restrepo 2020).
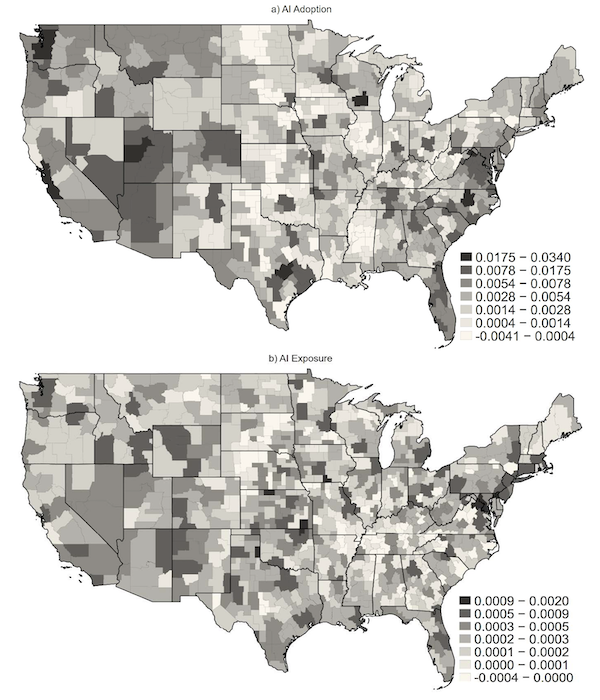
Figure 1 is a color map showing how AI adoption (panel a) and exposure to AI (panel b) vary across U.S. CZs. Darker colors represent higher levels of adoption or exposure during the sample period. Negative values are very rare (only 6% of CZs), indicating that adoption of AI technologies has been a widespread phenomenon in the U.S. over the past two decades. Interestingly, our measure of AI adoption (panel a) captures AI diffusion very effectively in both expected locations such as Boston, Seattle, and Silicon Valley, as well as in newer tech hubs such as Boulder, Bozeman, and Salt Lake City. Our measure of AI exposure (panel b) eliminates fluctuations in AI adoption that are likely driven by contemporaneous CZ-level shocks that could confound our estimates.
Figure 1 Adoption of and exposure to AI in U.S. commuter areas

sauceIn: U.S. Census and American Community Survey.
Note: The top map plots the average values of the indicators of AI adoption in each CZ from 2000 to 2010 and from 2010 to 2020. The bottom map plots the corresponding values of the indicators of AI exposure.
The negative impact of AI on employment
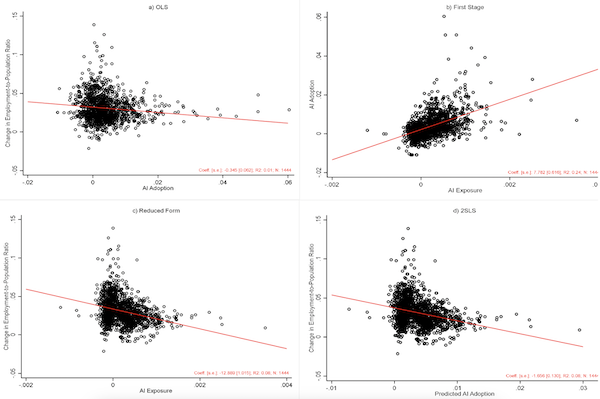
Figure 2 graphically presents our empirical strategy and main results. The points in each of the four scatterplots represent the observations for each CZ and decade (2000–2010 and 2010–2020), and the red lines are linear regression lines. Panel a (OLS) shows that there is a negative correlation between AI adoption and the decade-by-decade change in the employment-population ratio at the CZ level. Panel b (first-stage) confirms that exposure to AI is a strong predictor of AI adoption and thus a powerful instrument for the deployment of these technologies. Panel c (reduced form) shows that exposure to AI is strongly negatively correlated with employment growth. Finally, panel d (2SLS) plots the relationship between AI adoption predicted by exposure to AI and the decade-by-decade change in the employment ratio, highlighting that AI adoption has a strong negative (causal) effect on employment growth. Overall, these charts show that CZs specializing in areas experiencing rapid growth in AI-related employment have experienced higher AI adoption rates, resulting in a relative slowdown in hiring. Quantitatively, our estimates suggest that CZs with average AI adoption rates during our sample period would have seen their employment rates increase by 0.6 percentage points if AI had not been adopted at all.
Figure 2 AI Adoption, Exposure, and Employment in U.S. Commuting Regions

Note: The estimation sample consists of 722 CZs observed over the 20-year period 2000-2010 and 2010-2020. In each plot, the observations are CZ x decade pairs. Predicted AI adoption is the fitted value of the measure of AI adoption obtained from the first-stage regression in plot b).
These results are robust to controlling for several additional labour market shocks, such as import competition from China (Autor et al. 2013), the introduction of industrial robots (Acemoglu and Restrepo 2020), and increasing ICT use, and they remain consistent when using alternative definitions of AI-related jobs and when controlling for outliers in different ways.
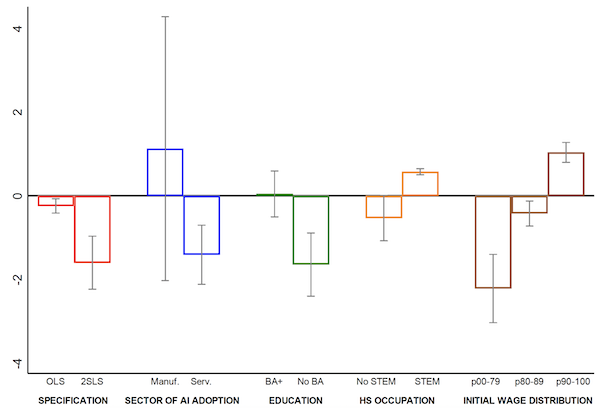
Figure 3 shows how the relationship between AI adoption and employment growth varies across specifications. The figure highlights three main findings. First, the effect of AI adoption is much stronger when AI adoption is measured using AI exposure (2SLS vs. OLS specifications). This indicates that confounding factors tend to mask the negative impact of AI on employment. Second, the impact of AI is driven by adoption in the service sector, where adoption of these technologies is more prevalent. Third, workers without a college degree are most negatively affected by AI adoption. Conversely, the only workers who benefit from AI adoption are those in occupations that require a STEM degree and those in the top 10% of the income distribution.
Figure 3 Heterogeneity

Note: This figure shows the estimated coefficients and 90% confidence intervals for measures of AI adoption for different specifications. The estimation sample consists of 722 CZs observed over the 20-year period 2000-2010 and 2010-2020.
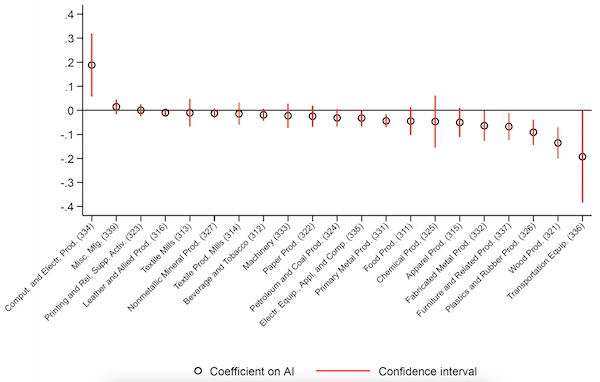
Our findings also show that the negative impact of AI adoption is not limited to the service sector, but also extends to manufacturing employment, where the use of these technologies is still limited. Specifically, manufacturing accounts for about 45% of the overall employment impact of AI adoption, while the service sector accounts for 60%. To shed light on the mechanisms behind these spillover effects, Figure 4 shows the estimated employment impact of AI adoption across different manufacturing industries. The figure shows that workers in industries with high automation intensity, such as transportation equipment and wood products, are particularly hard hit. This suggests that AI adoption in the service sector may actually be used to automate manufacturing jobs.
Figure 4 AI adoption and employment in manufacturing

Note: The estimation sample consists of 722 CZs observed over a 20-year period from 2000–2010 and 2010–2020.
Conclusion
Recent advances in the field of AI have generated a lot of hype about the future of work. While no one can predict exactly which direction new innovations and applications will take, we believe it is important to start by understanding the consequences these technologies have already had. Our results show that the introduction of AI has a strong negative impact on employment for most workers and sectors. Although more micro-level evidence is needed to precisely pinpoint the mechanisms through which these negative effects spread, our evidence is consistent with the view that AI is contributing to job automation and widening inequality.


