Hi, Yves. This study has an interesting aim to measure changes in clothing and hairstyles as indicators of style uniformity, but I doubt that high school yearbooks from the 1960s and 1970s would be a good indicator. There was a lot of resistance within the schools to relaxing the dress code. Because miniskirts were popular in the 1960s and the original Star Trek exposed legs, girls were generally not allowed to wear skirts above the knee. Trousers were also prohibited. Jeans were definitely not allowed as school attire.
Notably, this study uses a 1966 yearbook that depicts boys in suits and conservative hairstyles.
My dad graduated from Harvard Business School in 1965, the oldest of his class. Last year, while we were cleaning out our house, we found a photo of his classmates. It looked like an exam photo. He and four of his classmates were in profile. He was in a suit with short, cropped hair. The other guys had sideburns and long hair and were dressed as if they were auditioning to join the Beatles.
By David Yanagizawa-Drott, Professor of Development and Emerging Markets at the Department of Economics, University of Zurich. Originally published in Vox EU
Style choices are an important aspect of culture, often used to signal individualism or group affiliation. In this column, we use over 14 million images from high school yearbooks to trace cultural change across time and space in the United States. Male and female style traits have converged since the 1960s, driven by increased individualism and less style persistence in men. Furthermore, we show that new style innovations predict patenting rates, suggesting that cultural change may drive innovation in other domains later in life.
Imagine walking down the hallways of an American high school in the 1950s. You see a sea of norms: boys with crew cuts, often in sports jackets and ties, and girls in modest dresses and perfectly coiffed hair. Fast forward to today and you’re greeted with a dizzying kaleidoscope of colors, hairstyles and fashion choices. This stark contrast is a powerful reminder that culture is not just a collection of beliefs and attitudes, but a way of life that is constantly evolving and shaping society.
In recent years, great strides have been made in analyzing culture as a “way of life” using data on consumption patterns, folklore, and naming patterns (Bazzi et al. 2020, Michalopoulos and Xue 2021, Atkin 2016). To analyze style choices as a key aspect of culture, we need two things: data and a way to let them speak. In our study (Voth and Yanagizawa-Drott 2024), we track cultural change using portrait photographs of US high school seniors from 1950 to 2010. The idea of using photography as a window into social trends is not new. Victorian polymath Francis Galton famously used synthetic images to create “architectural” faces of criminals and prostitutes (Galton 1878). Thanks to the wonders of machine learning, we can analyze cultural change on an unprecedented scale. In a recent landmark study, Adukia et al. (2022) used images from children’s books to track racial stereotypes: In our study, we examined over 14 million images from 111,000 high school yearbooks, tracking stylistic choices across time and space.
We use three main concepts: Individualism (How many students at each high school are trying different styles from their classmates?) Tenacity (the similarity between the current style and the style of 20 years ago), and Novelty of style (emergence of previously unseen style choices). Consider Figure 1, which shows a portrait of seniors who graduated from Attica High School in New York in 1966. We can see that they dress very similarly (dark suits, ties, collared shirts, no beards). Based on their style choices, we calculate a high similarity index of 0.9. The same calculation style is the basis for our persistence analysis. Compare the cohorts who graduated from the same school 20 years ago (Figure 2). In Panel A, we see low persistence, with a dramatic change in style choices. In Panel B, the differences are much smaller, except for more flashy bow ties and longer hair. Hence, we calculate a high persistence score.
Figure 1 The Calculation of Individualism
 <
<
Note: This figure shows the calculation of the individualism score, calculated as (1-average cosine similarity) for individual i when compared to all images of other seniors of the same gender from the same high school cohort. The individual on the left has a score of 0.098, indicating a low level of individualism, as most style choices (suits, hairstyles, ties) are similar.
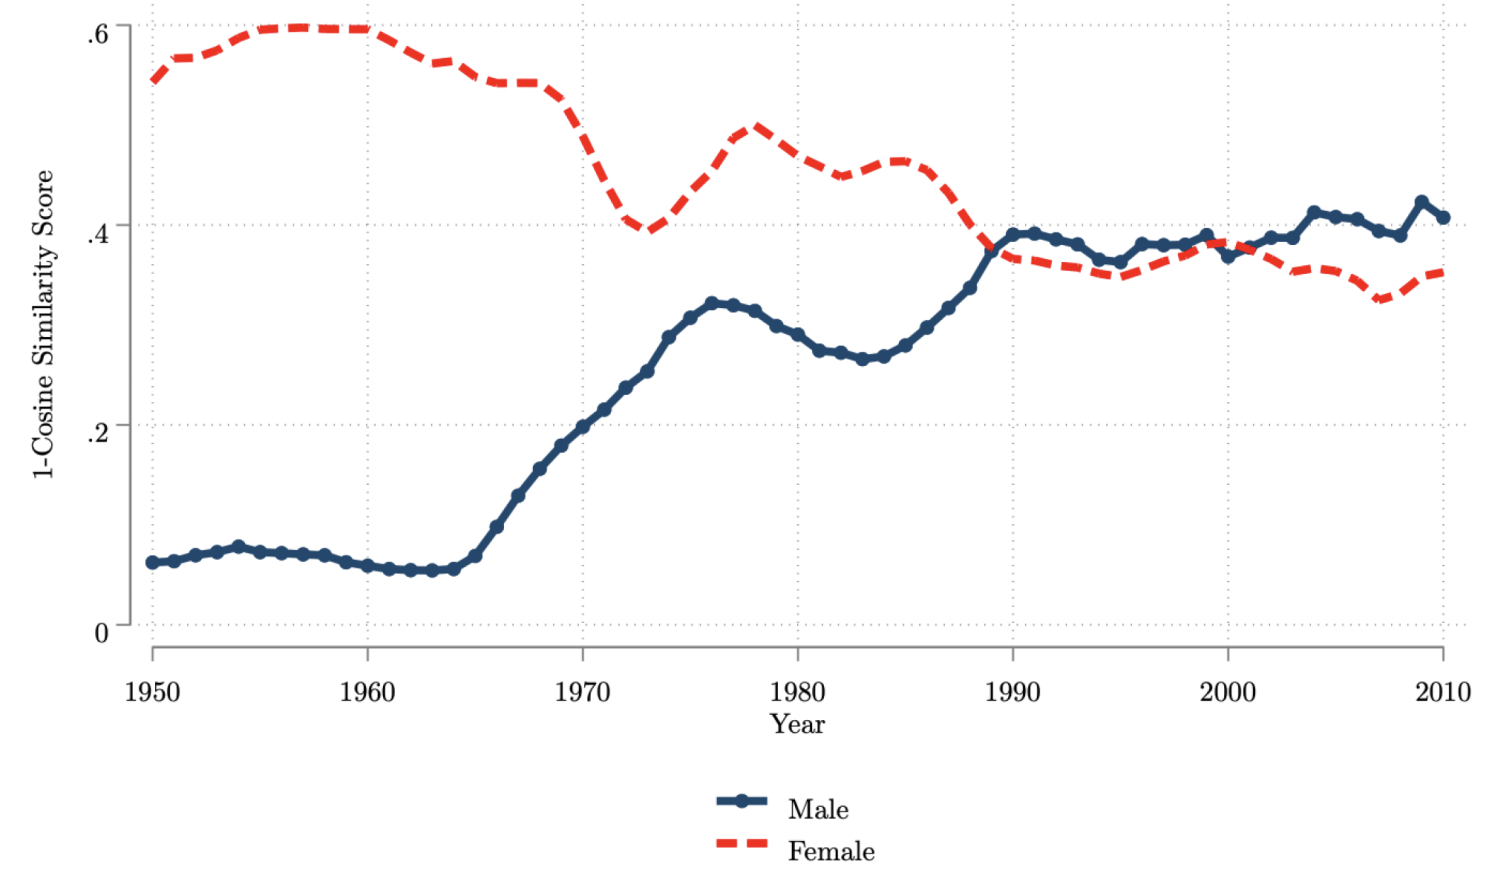
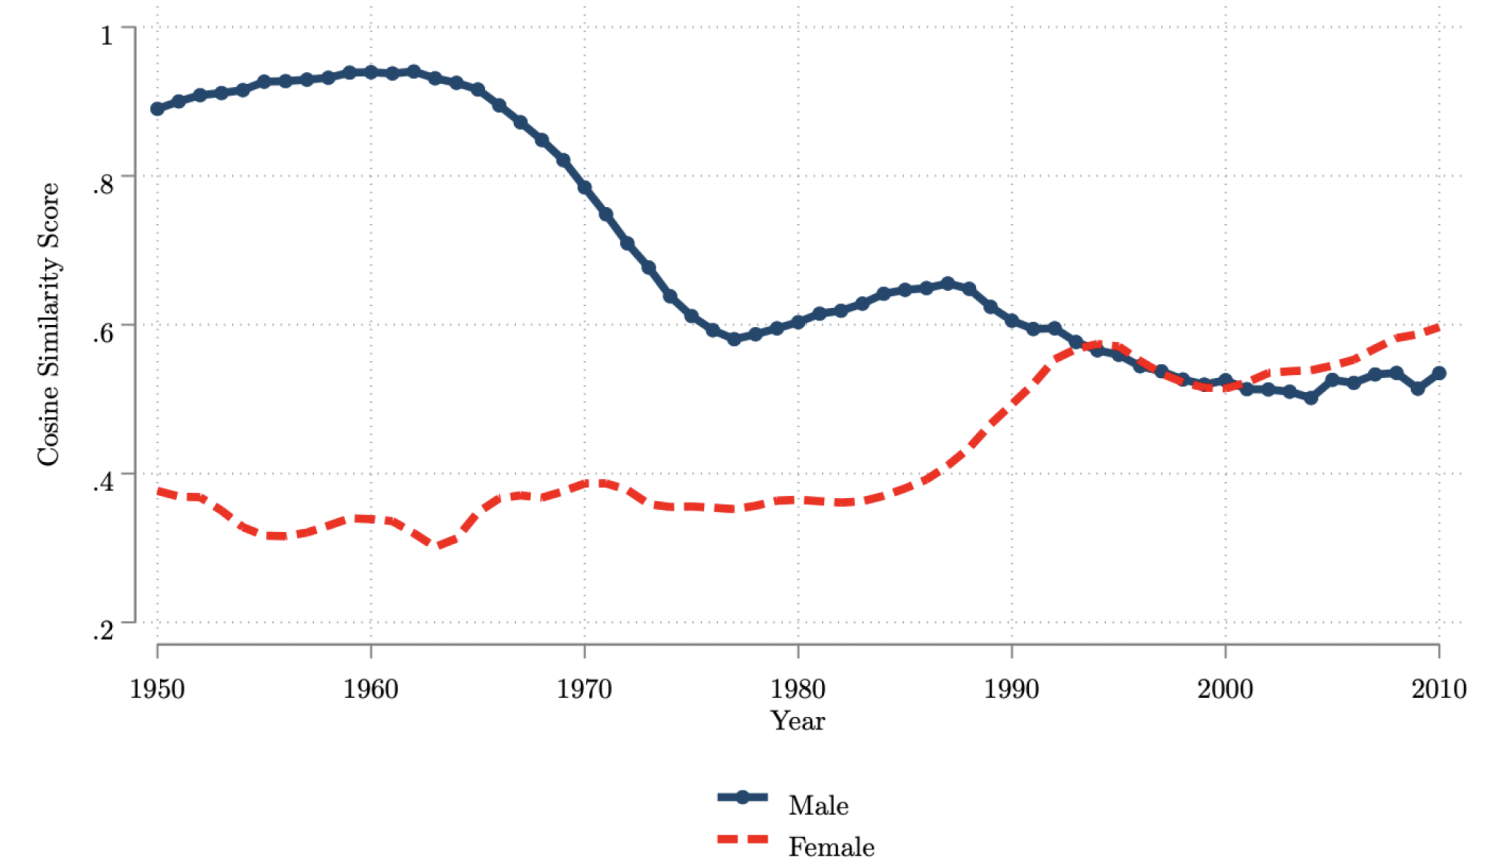
These indicators allow us to paint an interesting picture of the cultural evolution of post-war America, outlined in Figure 3. The main message is that male and female style traits converged from the mid-60s onwards, as the women’s rights movement emerged and old role models were phased out. Levels of individualism and persistence converged by the 1990s.
In the 1950s and early 1960s, men were low in individualism; they were mostly like their parents 20 years earlier. But as Bob Dylan predicted, times were changing. This equilibrium was dramatically upset in the late 1960s, and individualism soared. In the decades that followed, individualism continued to fluctuate around the upward trend.
In contrast, women’s initial emphasis on class diversity (“individualism”) has declined since the 1960s. At the same time, it has become more persistent since the late 1980s, approaching men’s levels. There has been a notable increase in style innovation for both men and women. Men’s style innovation exploded in the late 1960s and reached unprecedented levels for both men and women by 2010.
Figure 2 Sustainability
a) Examples of low persistence
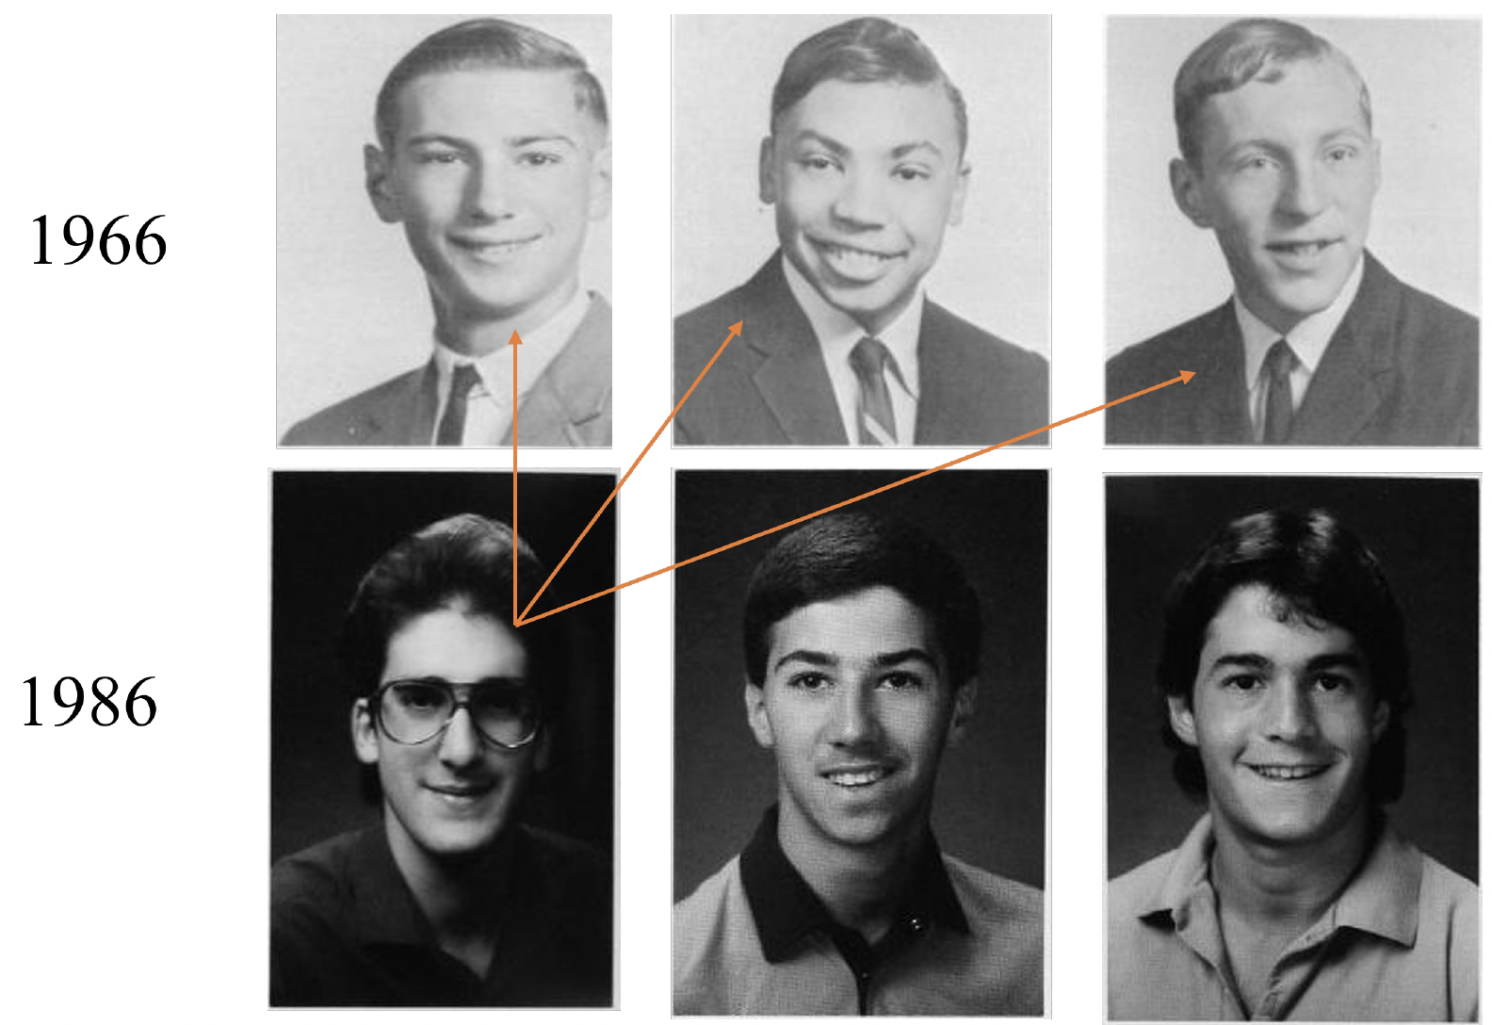
b) Examples of high sustainability
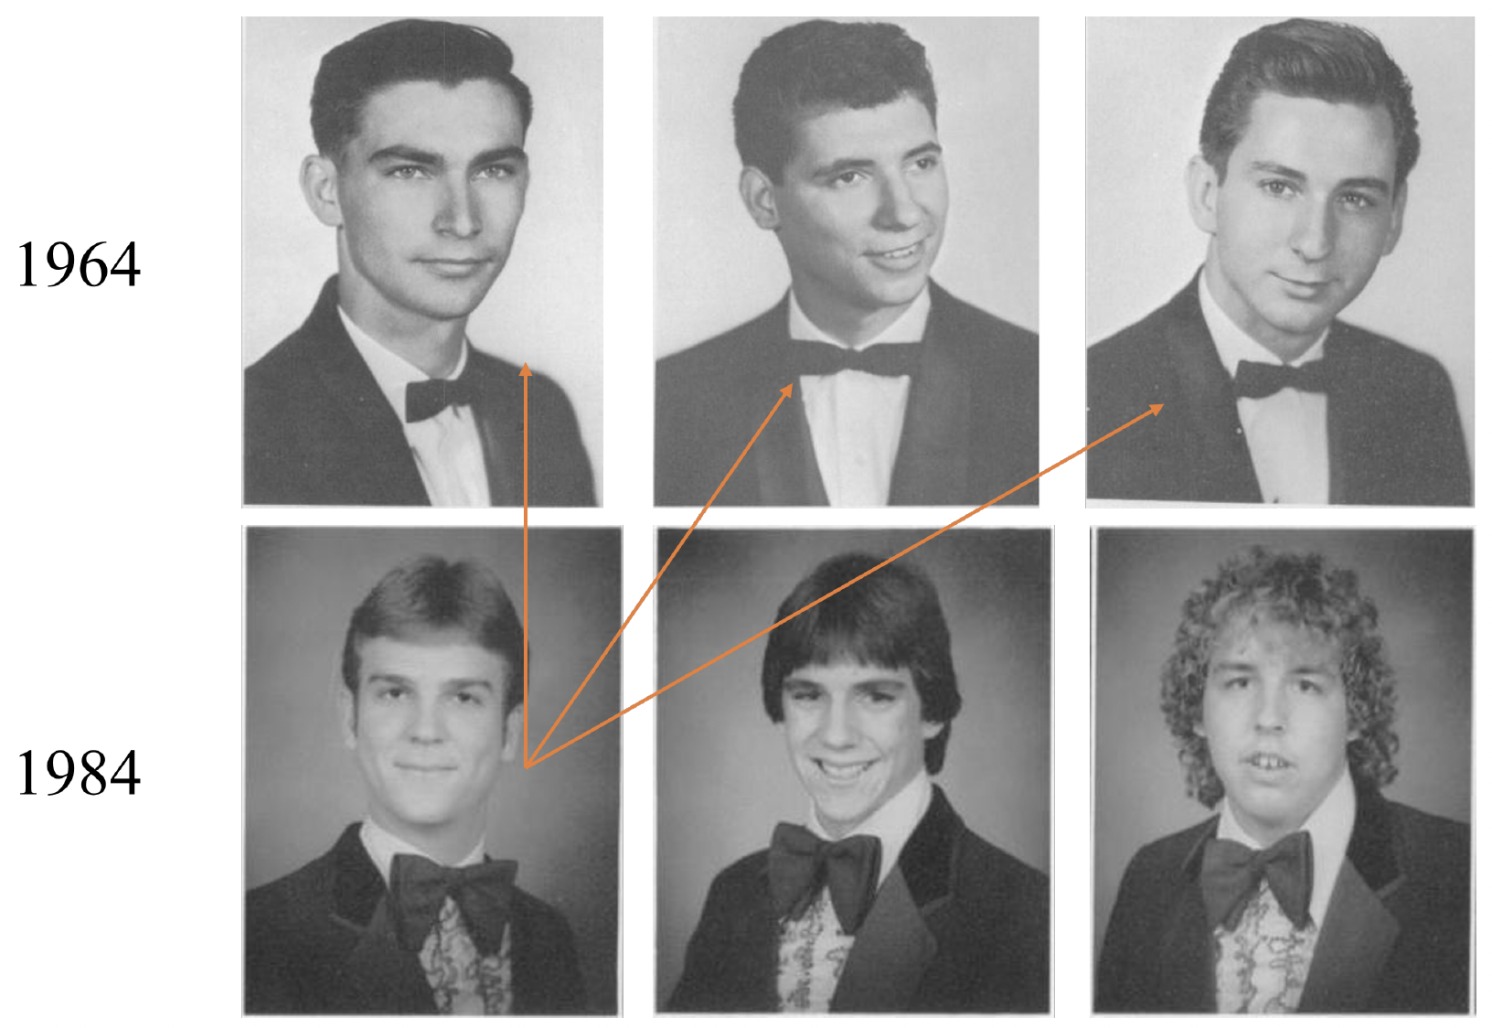
Note: This figure shows the calculation of persistence scores. We calculate the similarity of everyone in a cohort and compare each to the style of graduates (of the same gender) 20 years ago. We then average this score across the cohort. Panel (a) is an example of low persistence (0.056). Panel (b) is an example of high persistence (0.83).
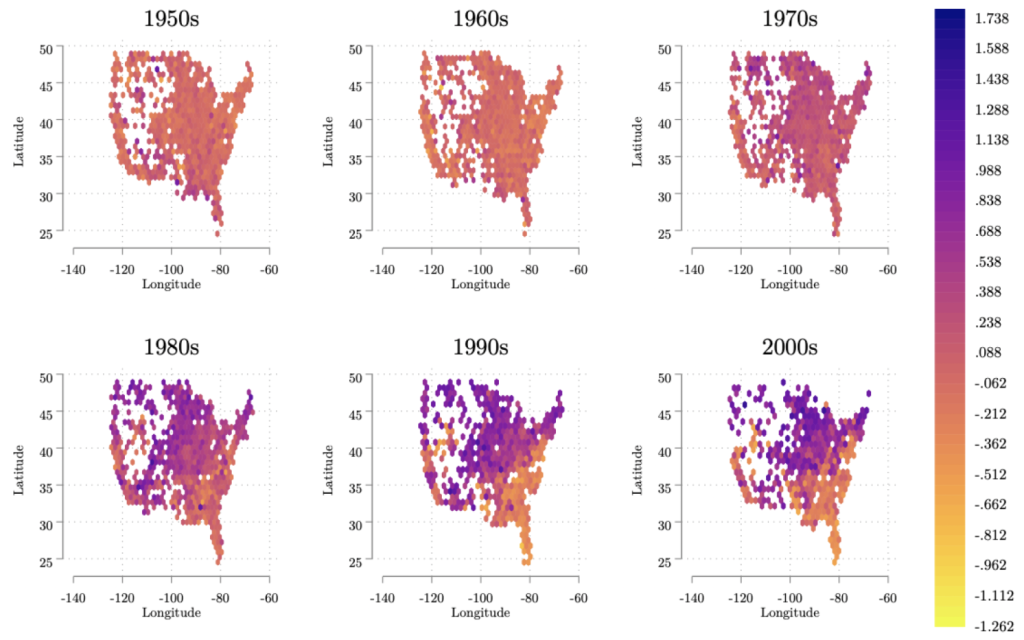
In the 1950s, individualism and tenacity were highly uniform across schools. But in the 1980s, clear divisions began to emerge. Schools became polarized, with some clinging to conformity and others embracing individuality to a greater extent. Perhaps not surprisingly, much of the old South remained a bastion of stylistic conformity.
Figure 3 Individualism, tenacity and timeless style
a) Individualism
b) Sustainability
c) Novelty of style
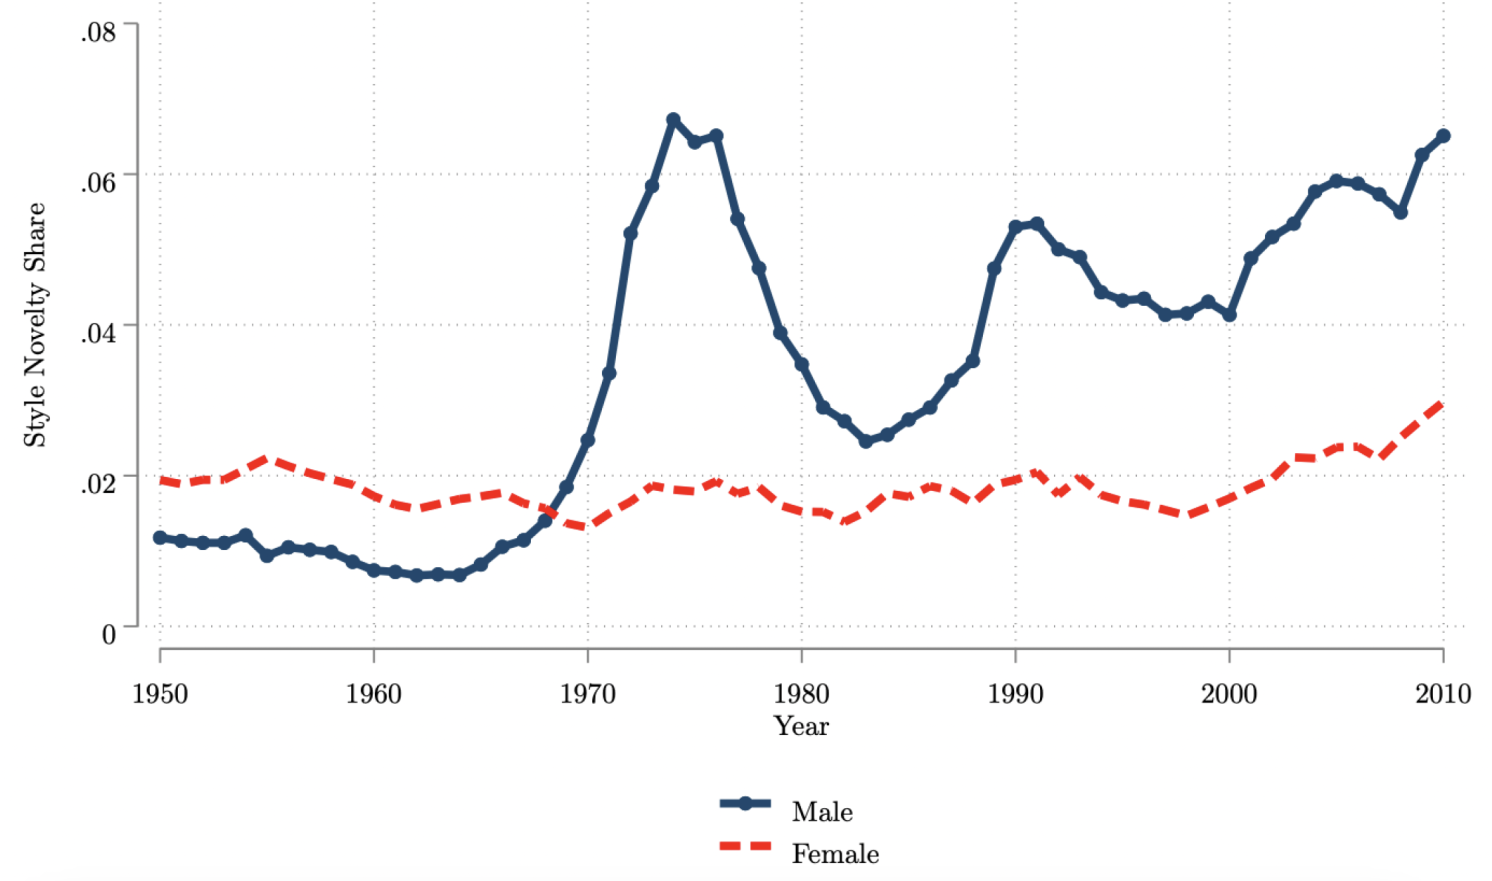
Note: This figure plots the annual mean cosine(persistence) score and 1 cosine(individualism) score for individualism (Panel A) and persistence (Panel B). Panel C plots the proportion of style innovators. Means are taken from an image-level dataset (14.5 million observations) split by gender.
Figure 4 Timeless individualism
Do these matter beyond the realm of fashion and hairstyles? Should economists care about necklines and ties in high school yearbooks? After all, there are potentially significant economic implications. We examine whether style novelty goes hand in hand with technological innovation. To solidify the idea, consider the case of Steve Jobs, who graduated from Cupertino High School in 1972. Jobs wore bow ties and tuxedos, had long hair and no beard or mustache. At this time, less than 0.3% of male U.S. graduates had ever worn this style, placing him in the category of a “style innovator.” Jobs subsequently applied for 1,114 patents, of which 960 were granted.
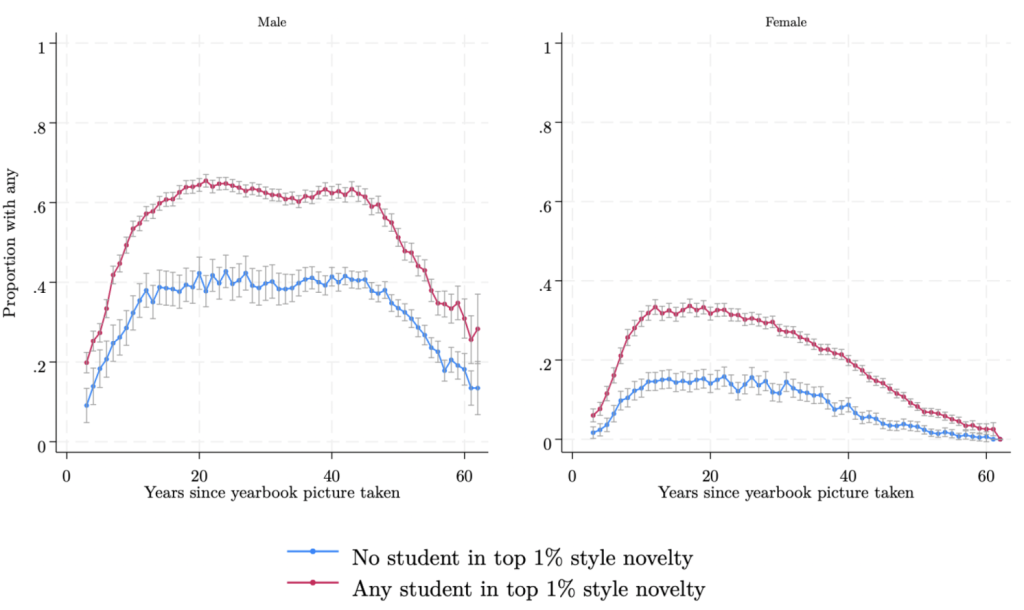
To see if the Jobs story could be generalized to the high school level, we carefully matched style innovations in commuter zones with patenting rates for people born in those zones 18 years earlier (using data from Bell et al. 2019). When we tracked successful innovations later in life, we found that areas with more style innovations also had more patenting. Figure 5 shows the results. Every year after graduation, students from high schools in areas with style innovators were significantly more likely to apply for (and obtain) patents. While giving boys earrings or forcing them to wear mohawks doesn’t necessarily increase technical creativity, schools that allow either of these style innovations may also produce graduates who excel in other fields. Given that innovation is an important driver of economic growth, these findings suggest that growing up in a slightly rebellious environment at a young age may have important benefits down the road.
Figure 5 The status of patent acquisition in commuting areas with and without style innovators, by number of years since graduation
So the next time you leaf through an old yearbook and chuckle at some outdated styles, remember: you’re not just looking at a series of odd fashions and silly expressions, you’re looking at an important aspect of cultural evolution — and one that could have a profound impact on the pace of technological change.
look Original Post reference


