by Calculated Risk July 1, 2024 8:12 AM
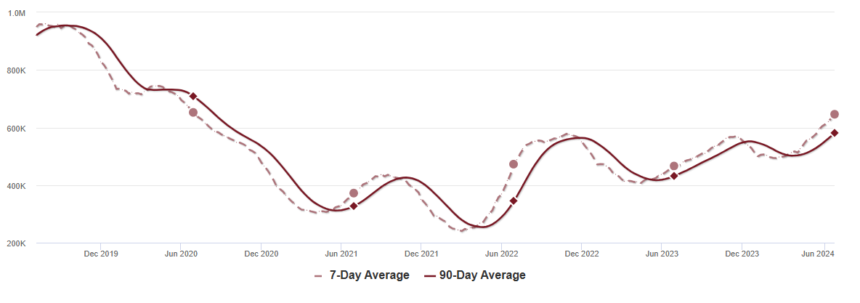
Altos reported that active single-family home inventory increased 1.8% week over week. Inventory is now up 30.7% from its seasonal low in February. The highest level since July 2020.
 Click on the graph to enlarge the image.
This inventory graph is Altos Research.
As of June 28, inventory was at 646,000 units (7-day average), down from 634,000 units the previous week.
Inventories remain well below pre-pandemic levels.
The second chart shows the seasonal patterns of active single-family home inventory since 2015.
The red line is for 2024 and the black line is for 2019. Note that while inventory is up 80% from the all-time low for the same week in 2021, it is still well below normal levels.
Inventory was up 38.4% compared to the same week in 2023 (up 37.7% the previous week) and down 33.2% compared to the same week in 2019 (down 33.6% the previous week).
Inventories should surpass levels seen during the same week in 2020 within two weeks.
As of June 2023, inventory was down about 54% compared to 2019, so the gap with normal inventory levels is slowly closing.


