Hi, I’m Yves. As the saying goes, “If you have to predict, predict often,” so that you can be more selective when your predictions come true. In terms of the election, in 2016, the common belief was that if Trump won, the market would crash. It did, but only for a short time, and then it started to bounce back very nicely.
Some die-hard conservatives believe that if Trump wins, “they” would crash the stock indexes, putting a damper on the soaring stock market and making it harder to govern, but with big business seemingly growing more comfortable with Trump’s return to the presidency, “they” may not have enough supporters to carry out their plan to crash the stock market.
What is more likely: a Democrat-led October surprise: war? Could Bibi, for example, hold off on his plans to attack Lebanon that long?
By Marco Albori, Alessandro Moro and Valerio Nispi Landi. Originally published in Vox EU
Stock markets are already expecting increased volatility ahead of the US presidential election. This uncertainty could further increase already high macroeconomic uncertainty. This paper analyzes the economic impact of changes in the US election odds from the perspective of financial markets. If Trump’s election odds increase, (1) US bond market volatility will increase, (2) stock market volatility will decrease and stock prices will rise, and (3) crude oil prices will fall. Therefore, financial markets expect the Trump administration to be relatively more market-friendly than the Biden administration.The essays focus on environmental issues and the sustainability of public debt.
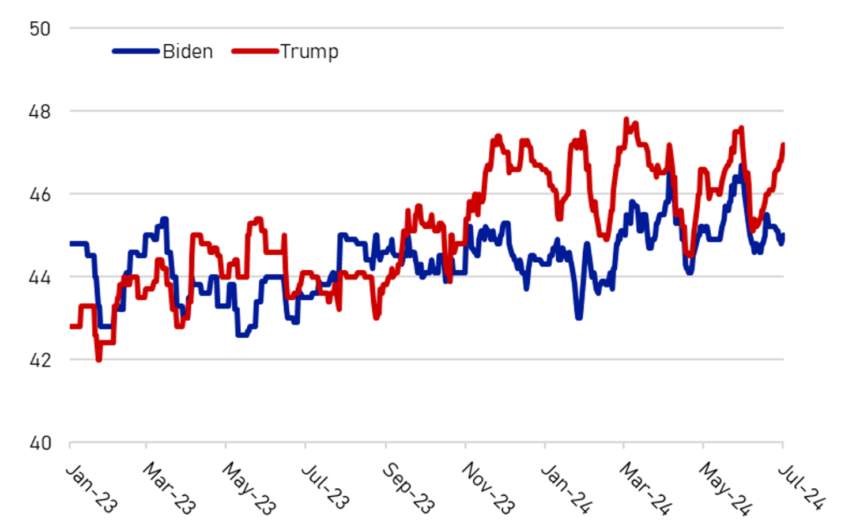
The US presidential election, which will determine whether Joe Biden or Donald Trump will win, will take place on November 5, 2024. The policies and personalities of both candidates provide ample reason for the market, and certain segments within it, to react to the news in anticipation of the outcome of the vote. 1 The candidates’ policies differ in important respects, including on energy, fiscal, and trade policies. Biden plans to strengthen the US green transition and increase taxes on corporations and high-income earners. Meanwhile, Trump plans to significantly cut environmental spending, introduce incentives to increase domestic oil and gas production, and lower tax rates. In addition, Trump has already proposed to intensify US tariff policy, especially against China, beyond the recently introduced tariffs on goods related to clean energy, semiconductors, and metals. These differences suggest future policy uncertainty in key economic areas. The difference in the polling between the two candidates is not large (Figure 1), leaving ample room for the market to form and update its views on the most likely outcomes. As shown by Rodden et al. (2020), the combination of a close election and polarization significantly increases US economic policy uncertainty.
Figure 1 US election polls are calculated as polling agency averages (data in percentages)
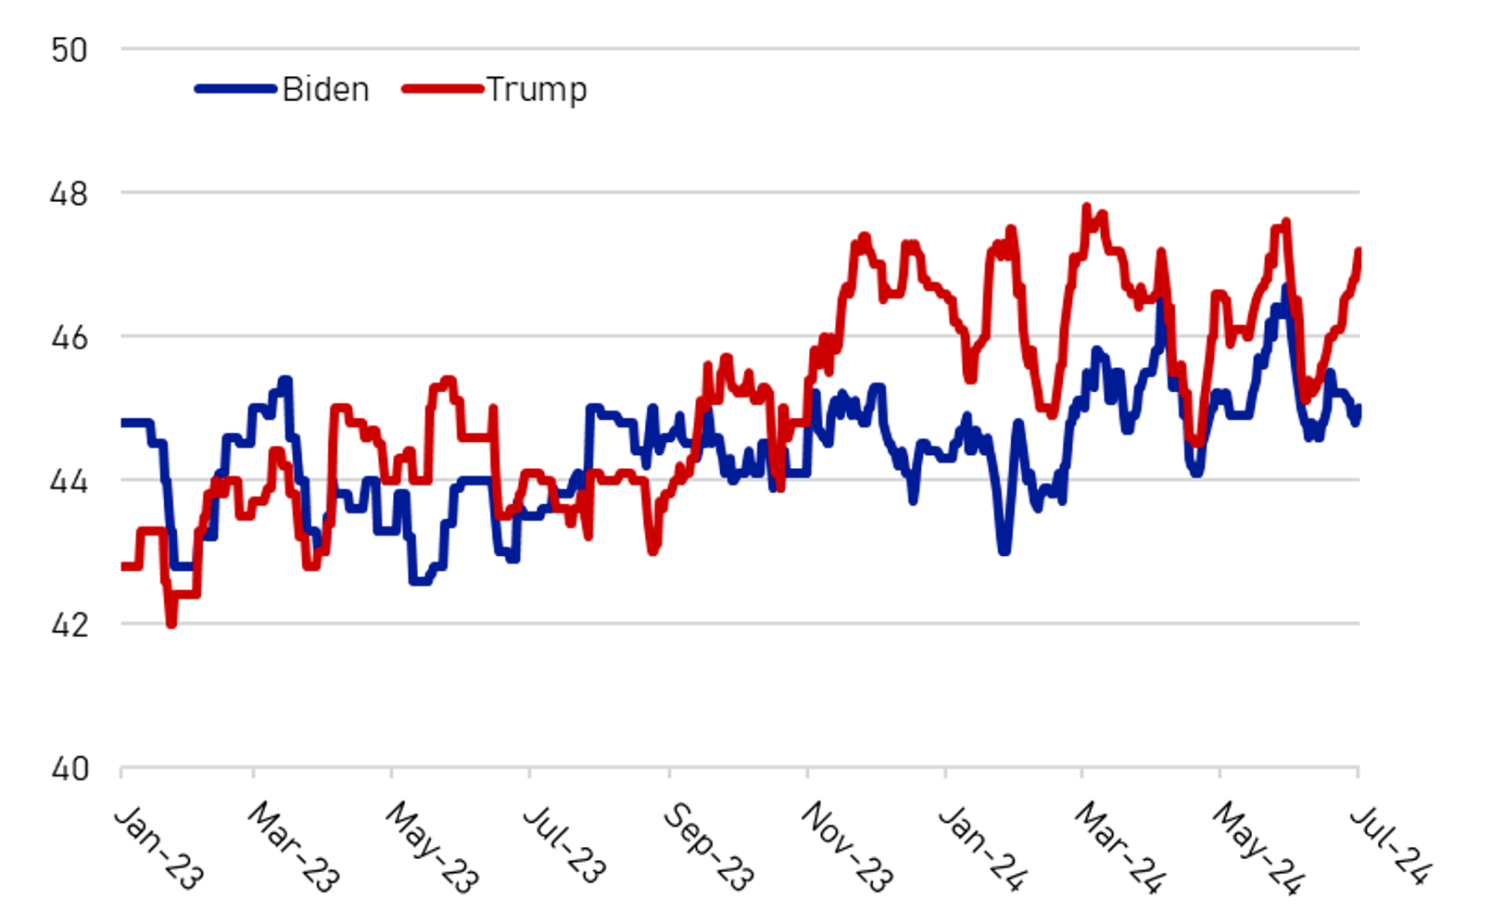
sauce: Bloomberg. Last observed: July 1, 2024.
Election-related uncertainty is certainly showing to be increasingly priced into futures contracts. Equity markets are expecting increased volatility around Election Day. Bilateral exchange rates against the dollar are also expected to experience higher volatility around Election Day, especially for currencies of countries at risk of a tariff war or tougher immigration policies in the event of Trump’s reelection.
We then set up a daily structural vector autoregression (SVAR) model to estimate the impact of an increase in the probability of President Trump’s reelection on a wide range of financial variables. We find that the response of most indicators is consistent with President Trump’s proposed policies, i.e., more market-oriented, less environmentally friendly, and less biased toward public debt sustainability. Our contribution of using financial instruments to measure investors’ political risk assessments and exploring their implications from a macro-finance perspective fits with the literature on the impact of political uncertainty on financial markets (Moramarco et al. 2020; Pástor et al. 2014; Veronesi and Pástor 2017).
Instability related to the US election
First, we present some stylized facts about financial market volatility around the next US election day, inspired by the analysis of Kelly et al. (2016). Stock markets expect an increase in volatility around the election day. Compared to the Obama-Romney (2012) and Clinton-Trump (2016) election races, US election risks have emerged earlier. Since March 2024, futures contracts linked to the VIX, which measures expectations of short-term fluctuations in the S&P 500 stock index, have been pricing in an increase in market volatility (month-on-month) in October and a decrease in volatility after the election day in November (Figure 2). 2 Similar movements in expected volatility were evident in 2020, when Biden and Trump first competed for the presidential election. 3 Rather, in 2012 and 2016, markets began anticipating a similar rise in volatility in October, just three months before the election, and did not anticipate a decline in November.
Figure 2 Stock Market Implied Volatility (Percentage Points): Comparison by Election Year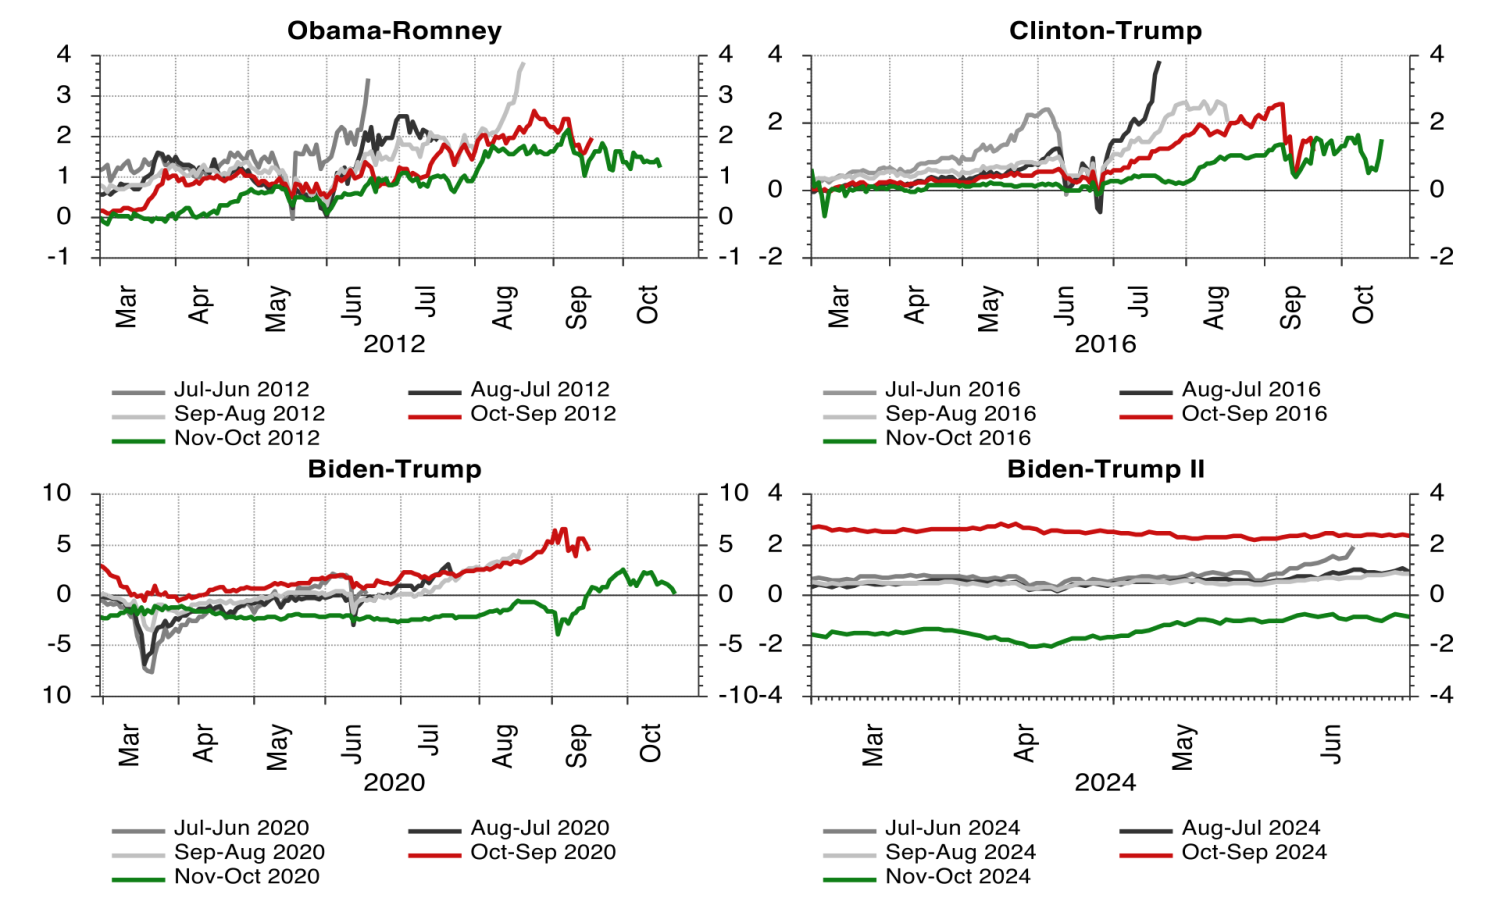
Note: This chart shows the price difference between VIX futures contracts expiring over two consecutive months. Futures contracts expiring on a particular date reflect the implied volatility for the following 30 days.
sauce: Refinitiv. Last observed: July 1, 2024.
The currency market (FX) is also expecting big fluctuations in foreign exchange rates over the US vote. Four To measure this phenomenon, we subtract the implied volatility of the US Dollar exchange rate against major currencies extracted from options expiring within six months (i.e. after the election) from the implied volatility extracted from the same options expiring within three months. The positive difference that emerged in the most recent months (since May 2024) indicates expectations of increased foreign exchange volatility closer to the election day. Five Expected currency movements around the US election are especially pronounced for the Chinese renminbi, which is at risk of a potential tariff war (Figure 3). That said, expected increases in euro and pound sterling volatility against the dollar have also been trending upward since May. A reasonable explanation for these results is that a Trump victory would likely mean more protectionist trade policies. Trump has already proposed a 10% import tariff across the board and is said to be considering a 60% tariff on Chinese imports.
Figure 3 Currency market implied volatility (data in percentage points)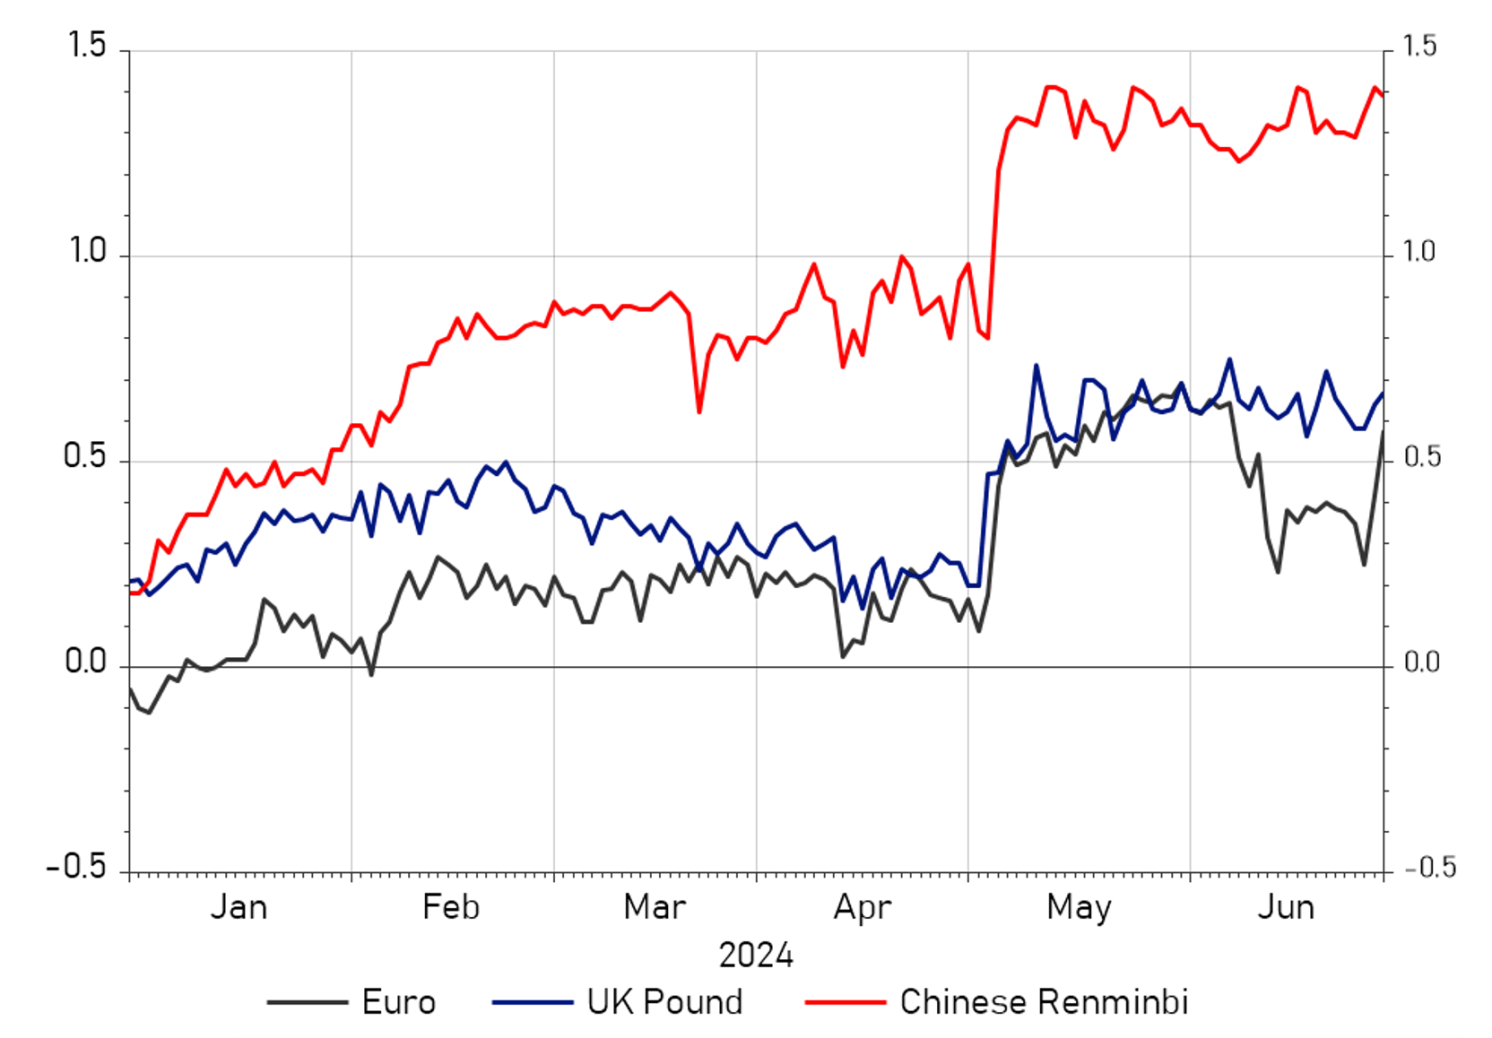
Note: The difference in implied volatility extracted from 6-month and 3-month options on the USD bilateral exchange rate.
sauce: Refinitiv. Last observed: July 1, 2024.
How a Trump reelection could impact financial markets
To assess the impact of the increasing likelihood of President Trump’s reelection on financial markets, we estimate a nine-variable daily VAR model for the period from January 3, 2023 to July 1, 2024. 6 We include the following variables: the Citigroup US Macro Surprise Index to control for economic conditions, the logarithm of the probability of Trump winning calculated as the ratio of voting intentions for Trump and Biden (this is our primary variable of interest), the logarithm of the Brent crude oil price, the logarithm of the Move which measures bond market volatility, the logarithm of the VIX which measures stock market volatility, the 10-year Treasury yield, the logarithm of the S&P 500, the logarithm of the US nominal effective exchange rate (NEER, an increase indicates a stronger US dollar), inflation expectations (5 years ahead, 5 years ahead).
We identify shocks to Trump’s electability using a recursive ordering based on short-run zero constraints (Cholesky decomposition) to order Trump’s election probability next to US macro surprises. The identifying assumption is that Trump’s electability is purified by day-to-day changes in US macro surprises, since those changes may cause voters to revise their decisions at the polls, while conversely, these surprises are exogenous with respect to the election odds. We further assume that financial markets can react to the election odds on the same day, but that the election odds may only be influenced by financial developments with a lag.
We find that a one-standard deviation shock to the probability of Trump’s election increases the probability by about 0.6% (Figure 4) and increases US bond market volatility. This may suggest that markets are pricing in higher credit risk due to the prospect of a larger budget deficit if Trump is elected. Instead, a higher probability of Trump’s election leads to lower stock market volatility and higher stock prices, which is consistent with the Republican candidate’s more pro-market stance.
Figure 4 The impact of the increased odds of President Trump winning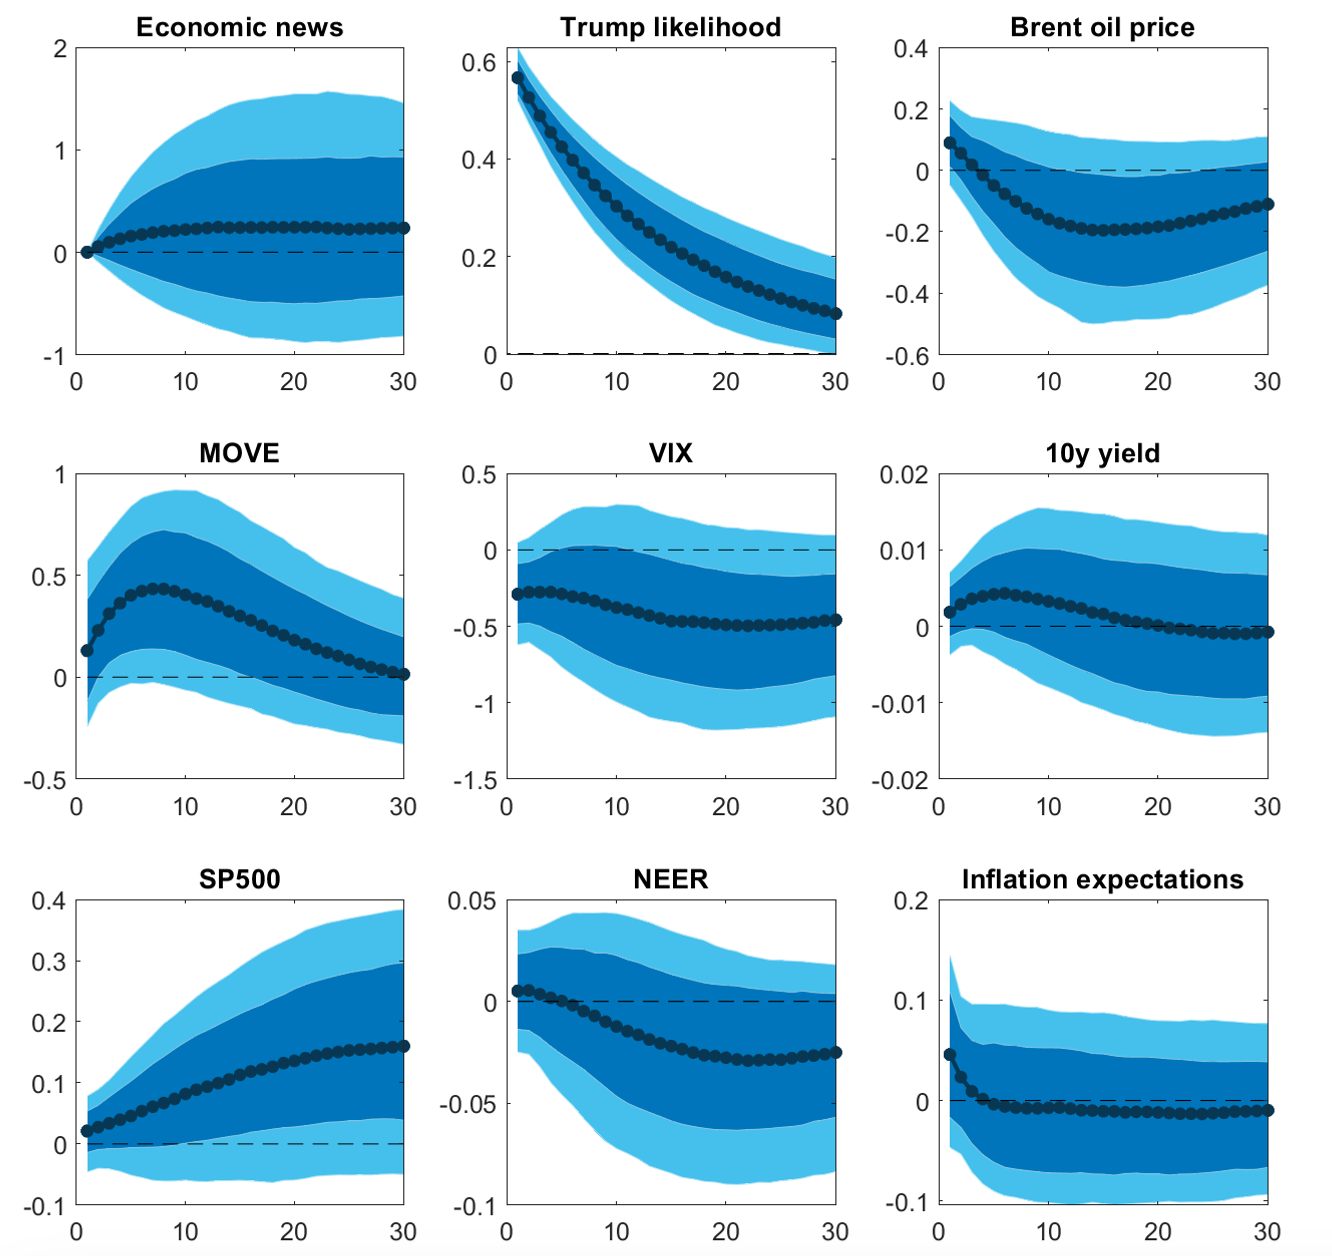
Note: This figure shows the daily impulse response functions and the 68-90% confidence interval. Responses are expressed in percentages, except for the 10-year Treasury yield (percentage points) and economic news (index).
The shock would also cause oil prices to fall as fossil fuel supplies are expected to increase, likely reflecting President Trump’s lack of concern for the environment, his skepticism about renewable energy, and his willingness to strengthen domestic commodity industries. 7 Finally, the impact on exchange rates and inflation expectations suggests a modest depreciation of the US dollar.
In a separate specification, we also include one stock index for each sector. We find that semiconductors, software, and defense-related industries are the sectors most positively affected by the increasing likelihood of Trump’s reelection. Presumably, these are strategic sectors that will benefit more from increased protectionism under the new Trump administration. We also estimate a model including corporate bond spreads (both investment grade and high yield) and find that an increase in the likelihood of Trump’s election leads to an increase in spreads. This is likely a result of the expected increase in budget deficits, increasing risk perceptions in the government bond segment and inducing a repricing of corporate bonds, which is consistent with the baseline results.
Figure 5 Trump Shock Extracted from Structural Vector Autoregression (SVAR) Model
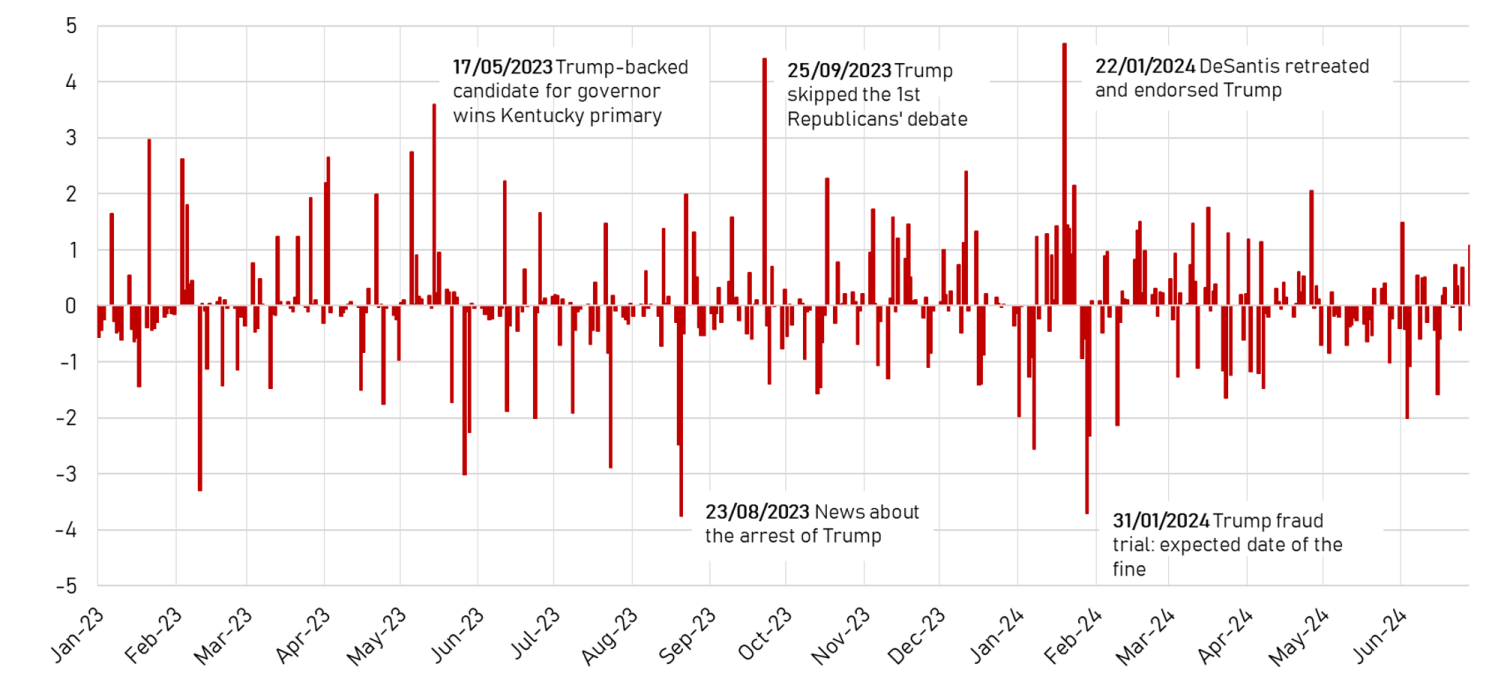
Finally, we check whether the identified shocks capture relevant news about the evolution of the electoral campaign. We plot the series and label some of the largest identified shocks (Figure 5). These spikes correspond to news about either the Republican campaign (when Ron DeSantis dropped out of the presidential race in January 2024) or Trump’s legal troubles (news about his arrest in August 2023 and fine on fraud charges in January 2024).
Author’s note: The opinions expressed in this article are those of the author and do not necessarily reflect the views of the Bank of Italy.
look Original Post References

