by Calculated Risk September 26, 2024 12:26 PM
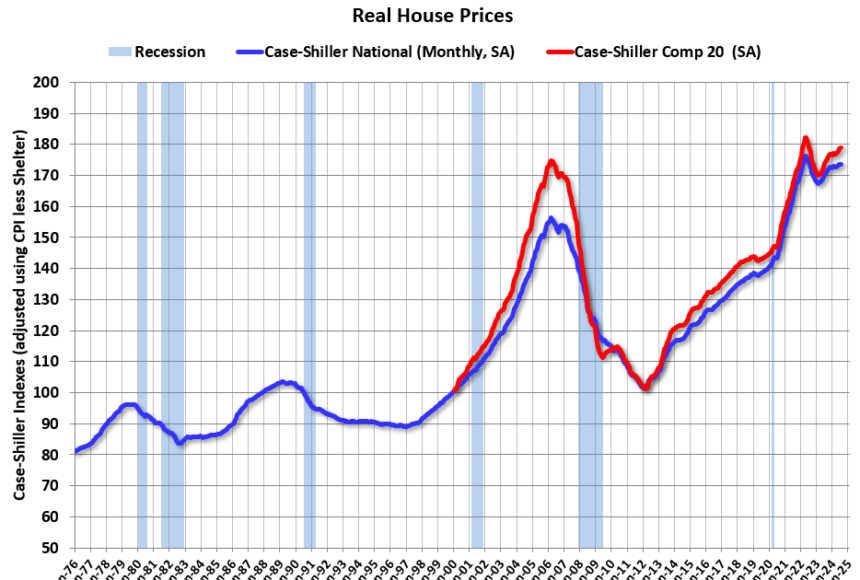
Today’s Calculated Risk Real Estate Newsletter: Inflation-adjusted home prices are 1.5% below their 2022 peak
excerpt:
More than 18 years have passed since the peak of the bubble. Case-Shiller Home Price Index for July On Tuesday, the seasonally adjusted National House Price Index (SA) was reported to be 74% higher than its bubble peak in 2006. However, in real terms, the National House Price Index (SA) is about 11% higher than its bubble peak (historically, real house prices have trended upwards), and the Composite 20 is, in real terms, 2% higher than its bubble peak.
Typically people graph nominal home prices, but it’s important to look at real prices too. For example, if a home cost $300,000 in January 2010, the inflation-adjusted price would be $432,000 today (a 44% increase). That’s why the second graph below is important – it shows “real” prices.
The third graph shows the price-to-rent ratio, the fourth graph shows the Home Affordability Index, and the final graph shows five-year real returns based on the Case-Shiller National Index.
…The second chart shows the same two indexes in real terms (adjusted for inflation using the CPI).
In real terms (using the CPI), the national index is 1.5% below its recent peak and the Composite 20 index is 1.8% below its recent peak in 2022. Both indexes rose in real terms in July.
It has been 26 months since home prices peaked. Typically, after a price surge, it takes years for real prices to reach new highs. Home prices: Seven years of purgatory)


