Pgiam/iStock via Getty Images
Investment Summary
Since my last publication on IQVIA Holdings Inc. (NYSE:IQV) in January 2023, there have been multiple positive updates to the company’s fundamental economics.
Last time, I commented on the company’s strengths in unlocking risk capital for shareholders, namely via 1) exceptional net operating profit after tax relative to the capital invested to produce these numbers, 2) decompression of post-tax margins with increasing capital turnover, and 3) the company’s propensity to throw off stable, high amounts of free cash flow to its owners.
Figure 1. IQV price evolution, 12 months
You can check out a deeper analysis on what the company does, its business lines, and recent business trends in my prior IQV analyses (click here, here, and here). To recall, IQVA is in the advanced analytics and clinical research services business. It has three divisions, (i) technology and analytics, (ii) research and development, and (iii) contract sales and medical solutions; each serves the global life sciences industry.
In 2014, the company did $4.16 billion of revenues on $357 million of earnings. It had grown this to $11.08 billion in sales on $191 million in earnings by 2020 and printed $14.9 billion in revenues last year with earnings of $1.36 billion. This translates to exceptional growth of ~17.6% per year from 2014-2020, with another 11% compounding growth from 2020-2023. Similarly, earnings have grown at a strong CAGR of 22% in the last 9 years, and compounded at 68% per year on average from 2020 to its annual results in 2023.
Table 1. IQV performance
|
Period |
Revenues CAGR (%) |
Earnings CAGR (%) |
|
2014-2020 |
17.67 |
-15.90 |
|
2020-2023 |
11.02 |
68.37 |
|
2014-2023 |
14.24 |
22.60 |
Source: Company filings
Investors continue to pay high prices to buy the company today, in addition to the healthcare sector in general. IQVA currently trades at 31x trailing earnings, in line with the sector multiple of ~32x, and is priced at 17x forward EBIT, again in line with the sector.
Despite this, the company’s stock price has tracked sideways YTD in 2024 amid a trending broad market. To me, this suggests a potential price dislocation, as 1) IQV’s earnings multiples have come down over the past three years, yet, 2) earnings have continued to grow at a steady rate, and 3) it continues to throw off high piles of free cash flow to methodically rotate into earnings growth, as I will show here today.
The tests driving my bullish thesis is that IQV:
-
Free cash flow production combined with earning growth.
-
Increasing capital turnover, suggesting greater efficiency on assets employed in the business.
-
Current valuations, supported by my projections of economic profit out to 2028, discounted at a 12% hurdle rate.
Based on these points, as you will see here today, my views are that IQV remains undervalued and is worth ~$248 per share in my base case today.
Q1 2024 Earnings Insights
It was another strong period in Q1 2024 from IQV in my opinion. It did $3.7 billion worth of business in the quarter and pulled this to adjusted EBITDA of $862 million, and earnings of $1.56 per share, ~14% year-on-year growth on a trailing 12-month basis. Importantly, excluding all COVID-19 related revenues, the company expanded its top line by 600 basis points from the prior year. Around 1% of this gross was driven from acquisitions, the remaining 5% from the underlying business.
Strength was observed across the portfolio, with the following topline results reported for each segment:
-
Technology and analytics:
-
Research and development solutions:
-
Produced sales of $2.1 billion, up 340 basis points year-on-year.
-
Management remains constructive on this division’s outlook going forward. For instance, it noted that backlog grew 8% year-on-year up to $30.1 million, with net new bookings of $2.6 billion.
-
This equates to a book-to-bill ratio of 1.2 (as a reminder, a book-to-bill ratio >1 is preferred, indicating the company has more orders in its pipeline than it can fulfill at a point in time).
-
-
Contract sales and medical solutions:
Management now projects $15.3 billion-$15.5 billion in top-line sales this year, calling for 2%-4% growth. Critically, this includes a forex impairment of ~100 basis points. This is not concerning to me for a couple of reasons.
For one, here at Bernard, we are looking for companies that have a revenue base outside of the US at the moment. Given the fiscal and economic situation in the US, this may be warranted in my opinion. In Q1 2024, of the company’s $3.7 billion in sales, $1.8 billion was produced in the Americas, whereas $1.15 billion was produced in Europe and Africa, and $778 million was produced in the Asia Pacific region. This is a good geographical split in my opinion, reducing concentration risk at the top line, and giving good exposure to non-US sources of revenue.
Management expects to pull these revenues to adjusted EBITDA of around $3.8 billion at the top end (6.5% year-on-year growth), and earnings of $11.25 per share on a non-GAAP basis.
My views on the company’s first-quarter numbers are that 1) management continues to produce steady free cash flow that it methodically rotates into earnings growth, and 2) that the company’s projections are reasonable estimates to work from going forward.
Additional Factors Contributing To a Bullish Stance
Since last reviewing the company, I have made several updates to my forward projections, which I will share here now.
The following facts pattern emerges on examination.
1). Increasing returns from margin growth, capital productivity
(Note: all figures are quoted on a trailing 12-month basis unless stated otherwise).
IQV’s lower than industry gross margins are an indication that it prices its offerings below industry peers, and may enjoy production advantages. This is further evidenced by the higher-than-average and higher-than-median pre-tax margins of circa 14%, illustrating that it has lower operating costs than the industry average. Lower operating costs as a percentage of sales equals higher operating profits. This is the return on sales.
| Gross margin | EBIT margin | FCF Margin | |
| Industry Avg. | 43.72% | -28.62% | -23.13% |
| Industry Median | 48.09% | -4.54% | 2.96% |
| IQV | 35.03% | 13.96% | 11.12% |
Source: Bloomberg
Curiously, the company achieves these results with a relatively low productivity rate, measured as revenue per employee. Of the industry group, the upper decile produces $462,000 per employee, with an average of $645,000 per employee, that is highly skewed by some of the data. The median revenue per employee of the life sciences tools and services industry is $306,975 (Figure 2). So IQV is in the lower percentile when it comes to revenue productivity.
Figure 2.
Bloomberg Finance LP, BIG Investment Calculations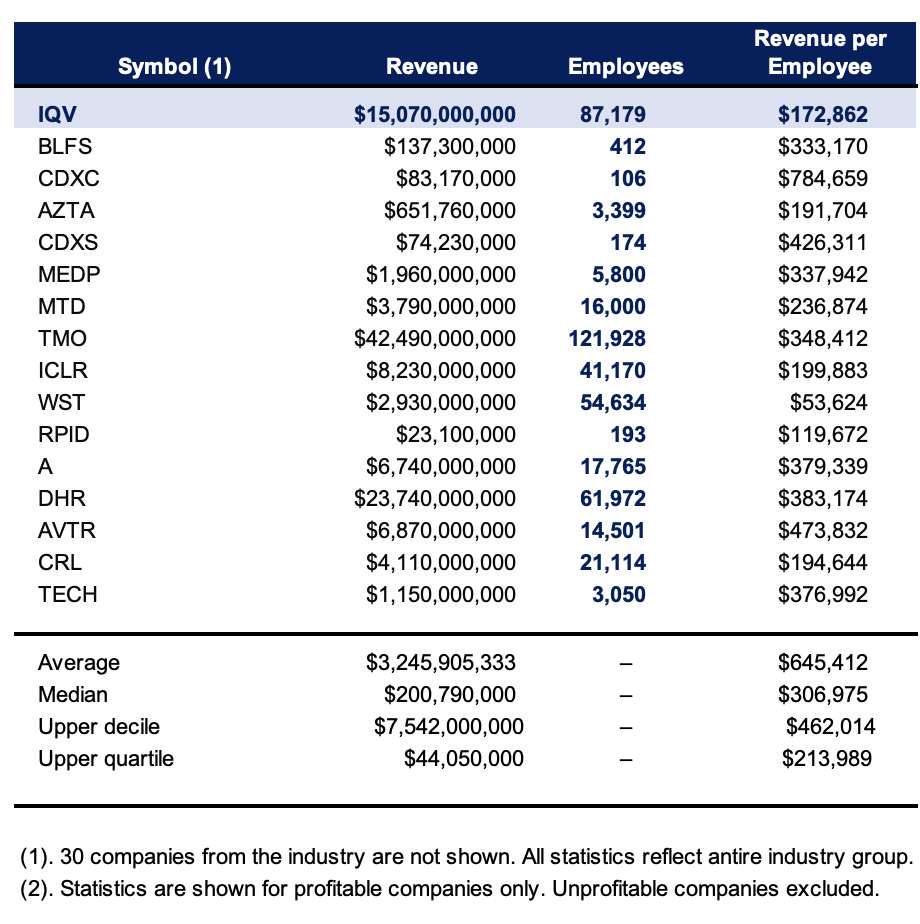
But when it comes to IQV’s “capital productivity” – i.e., profits earned per $1 of capital employed – it is a different story. I mentioned last time the company’s increasing returns are driven by 1) decompression of post-tax margins and 2) increasing invested capital turnover. This trend has continued in situ, as seen in Figure 3. Since December 2021, management has lifted the turnover of sales on capital from 0.72x, up to 0.78x in the last 12 months.
It also added another 300 basis points of post-tax operating margin over this time. On a rolling 12-month basis, after-tax margins have lifted from 13.1% in 2021 to 16.3% in the last period. Increasing margins are a catalyst to increasing earnings, and increasing earnings are central to my bullish thesis.
As a result, management has increased the return on capital invested in the business from 9.6% in 2021 to 13% in the last 12 months. This equals an incremental investment of $8.60 per share, against earnings growth of $4.20 per share, otherwise 49%, incremental return on capital.
This has produced exceptional free cash flows for the company’s owners, increasing from $9.70 per share three years ago to $14 per share in the trailing 12 months, 6.1% trailing free cash for yield as I write ($18. 80 share/8.2% FCF yield, including all buybacks).
Figure 3.
Company Filings, BIG Investments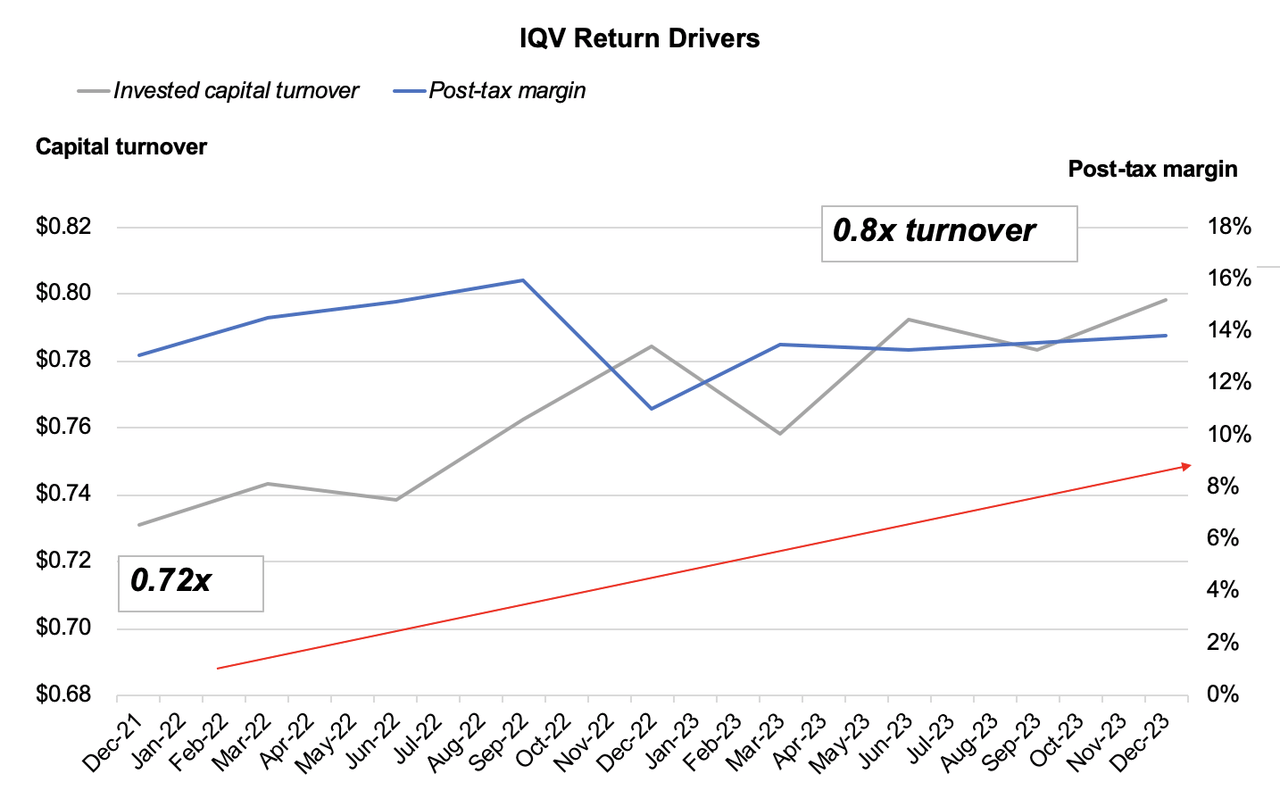
The means by which management has delivered this result is seen in Figure 4. Naturally, for a company this size and maturity, revenue growth of 1.1% each rolling 12-month period is unsurprising. What is attractive – the pre-tax margins of around 16-17%.
For each new $1.00 of sales and pre-tax earnings produced over this period, the company has invested a total of $0.195 cents to get there. If we include all acquisitions – which added around 100 basis points of growth to the top line this quarter – this is a $1.10 investment per $1.00 growth in revenue.
Figure 4.
Company Filings, BIG Investments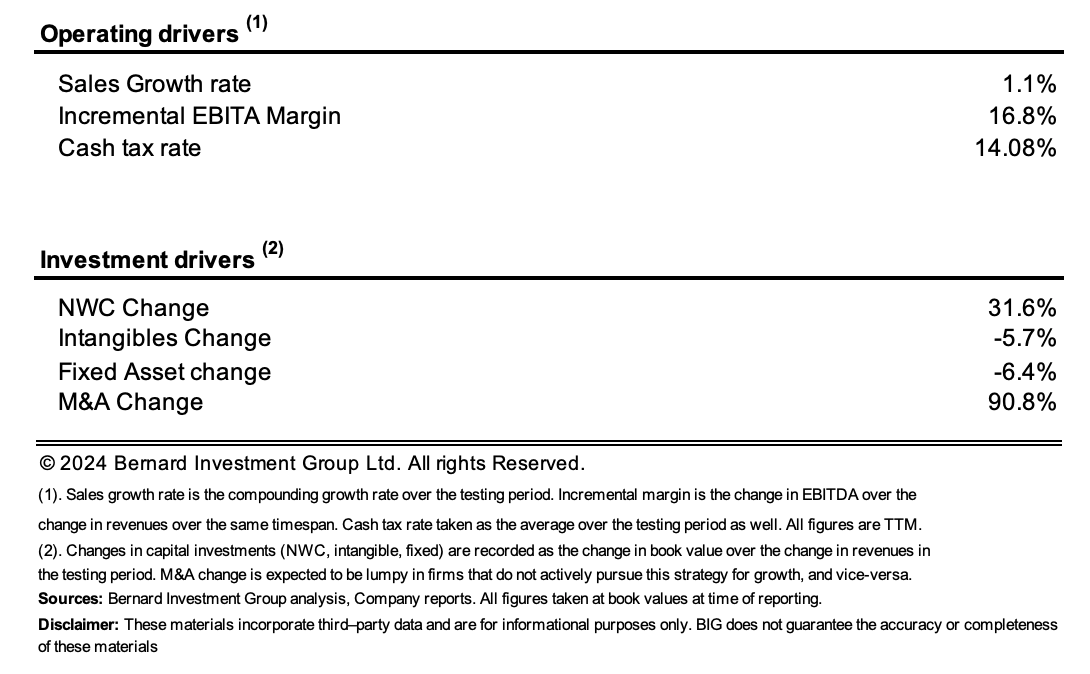
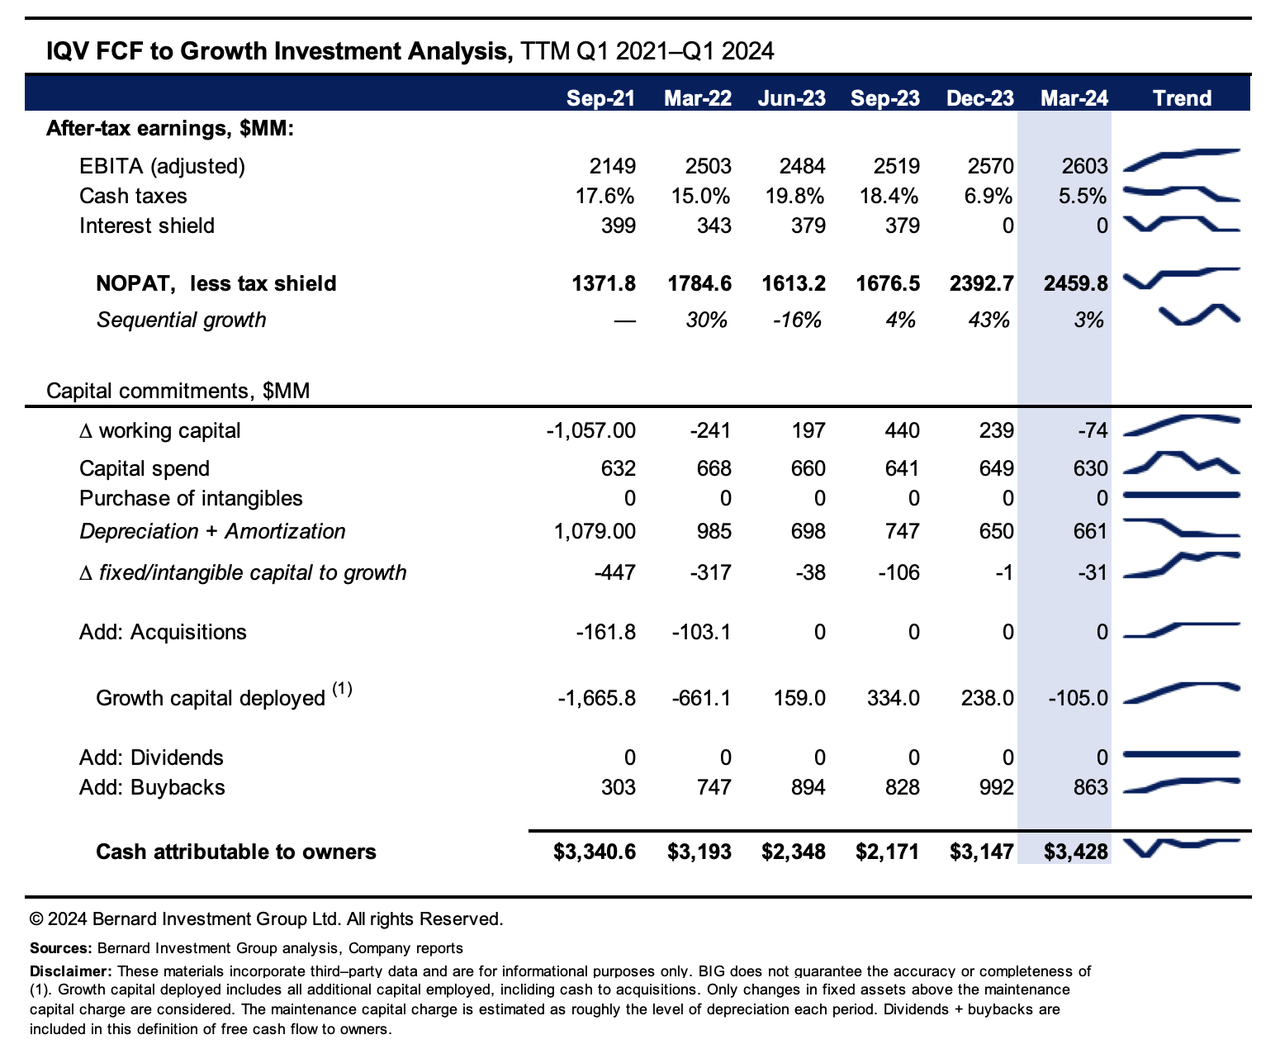
The increasing returns outlined earlier have been enabled management to throw off exceptional piles of free cash for the shareholders, as mentioned. This is even true after factoring in all growth and maintenance. This includes all capital expenditures required to maintain the company’s competitive position and grow.
Figure 5 shows the cash that is attributable to shareholders when factoring in management’s “growth investment”. Only changes in fixed assets and working capital above the maintenance capital charge are considered as growth investment. The maintenance capital charge is estimated as roughly the level of depreciation each period. I’ve also included buybacks distributed to shareholders here, as these 1) increase our ownership in the company without any additional investment, and 2) increase our free cash flow per share and earnings per share.
As observed, the company aggressively deployed cash to growth across the 2023 period. It also returned an average of $800 million-$900 million per rolling 12-month period from 2023 up to Q1 2024 in the form of buybacks to shareholders. After all reinvestments are considered, my calculations suggest that IQV is routinely throwing off $2 billion-$3 billion of free cash flow every rolling 12-month period, whilst comfortably investing surplus cash to grow the business.
I would characterize this FCF as stable and tremendously high, facts that cannot be ignored in my opinion. In terms of the ability to unlock value moving forward, this certainly is constructive.
Figure 5.
Factors Affecting Corporate Valuation
IQV currently sells at 31.3x trailing earnings and 25.7x trailing pre-tax income. The questions we’ve got in front of ourselves now are 1) Is the company fairly valued at these multiples, 2) what is the price/value calculus + how does this relate to the risk/reward calculus, and 3) what is driving the valuation multiples?
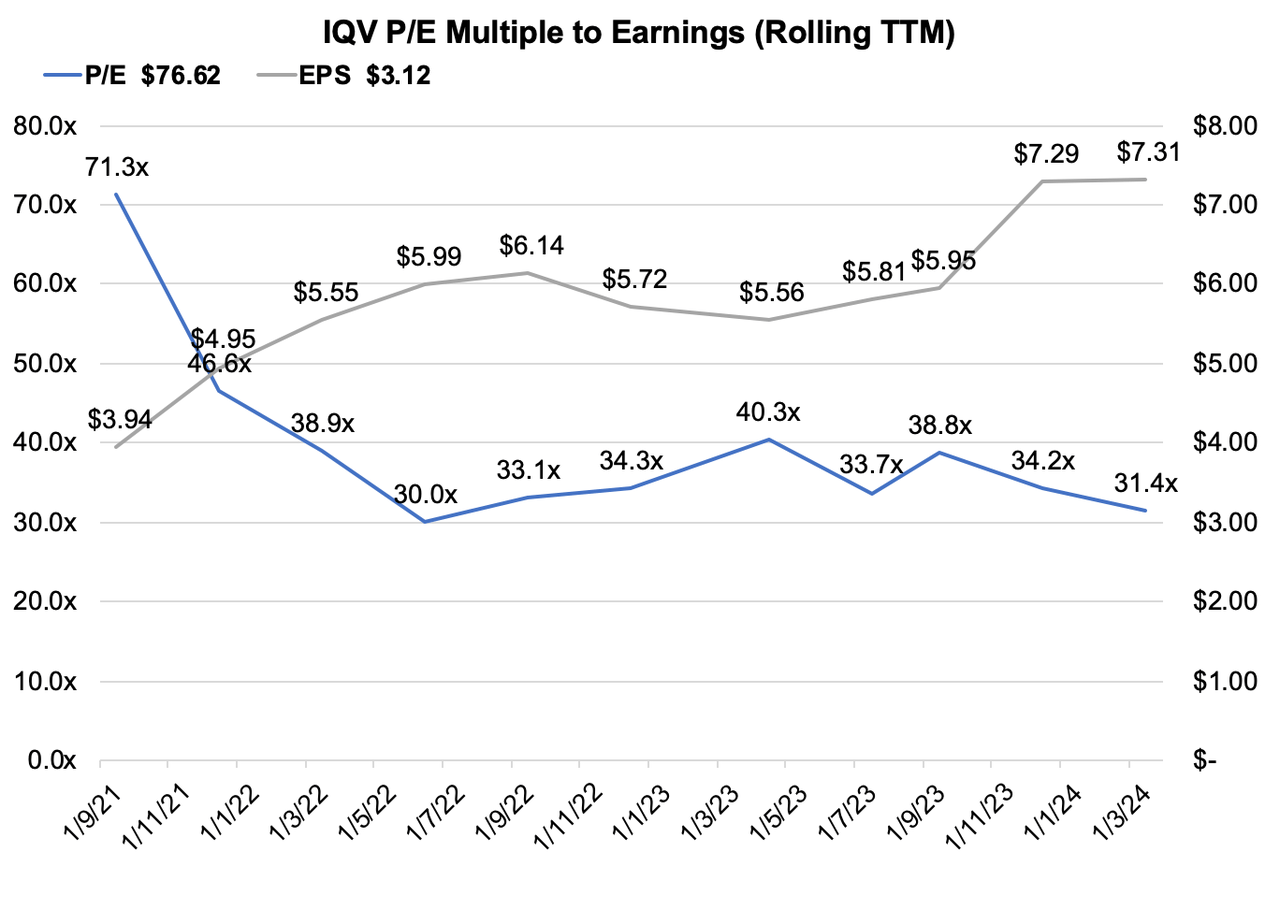
Let’s compare market price to the earnings of the assets of the company.
As seen in Figure 6, IQV’s trailing P/E multiple has contracted sharply over the past three years. It has clamped from 39x in Q1 2022, to 31.4x last period. From 2022, it has been flat. However, earnings have increased in most quarters, from $4.95 per year up to $7.31 per share in the TTM.
This divergence is quite appealing in my opinion. Since 2022, investors continue to pay a consistent P/E multiple for the company, potentially indicating their conviction. However, the denominator of the multiple – the “E” in earnings – has continued to rise, as the earnings multiple has remained relatively flat.
Consensus is looking at 8.7% bottom-line growth in 2024. If there is no change in the P/E multiple, then the company is worth $249 to me today, with implied earnings of $7.97 per share (31.3 x $7.97 = $249). Given these recent trends in the composition of the earnings multiple, it is reasonable to expect this might continue. I will run through the various scenarios on this a little bit later.
Figure 6.
The stock also trades at 6.6x book value. This implies that management has created $6.60 in market value for every dollar of net asset value on the company’s balance sheet. Whilst paying more than 6x the net tangible assets of the company is quite the ask, it does give hints to its intrinsic value, which may differ wildly from book value on any given day. Nevertheless, is important to deconstruct the return on these net assets to get the full picture.
As seen below, most of the company’s trailing return on equity is driven from leverage, with the 4.2x equity multiplier. Stripping leverage out of the equation, the return on tangible assets (ROE) reduces to 5.2%. Furthermore, if paying that high multiple of 6.6x, this reduces to 1.6% on a leverage-adjusted basis.
The company also trades at 2.8x the value of its invested capital. The trailing return of 13% reduces to 4.5% for the investor moving forward.
This is a clear testament to playing the long game with this company. These valuations are statistically high and reduce the price/value equation for the coming 12 months in my estimation. However, as I’ll discuss below, this is offset by the economic value IQV management can unlock if it continues to throw off such attractive rates of earnings and free cash flow.
Figure 7.
BIG Investments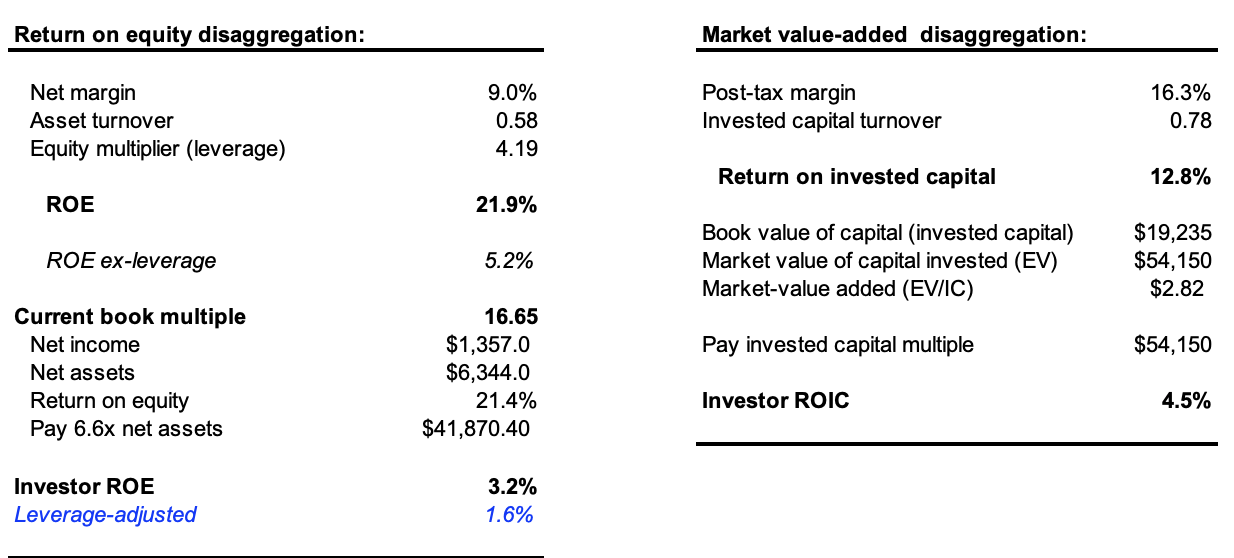
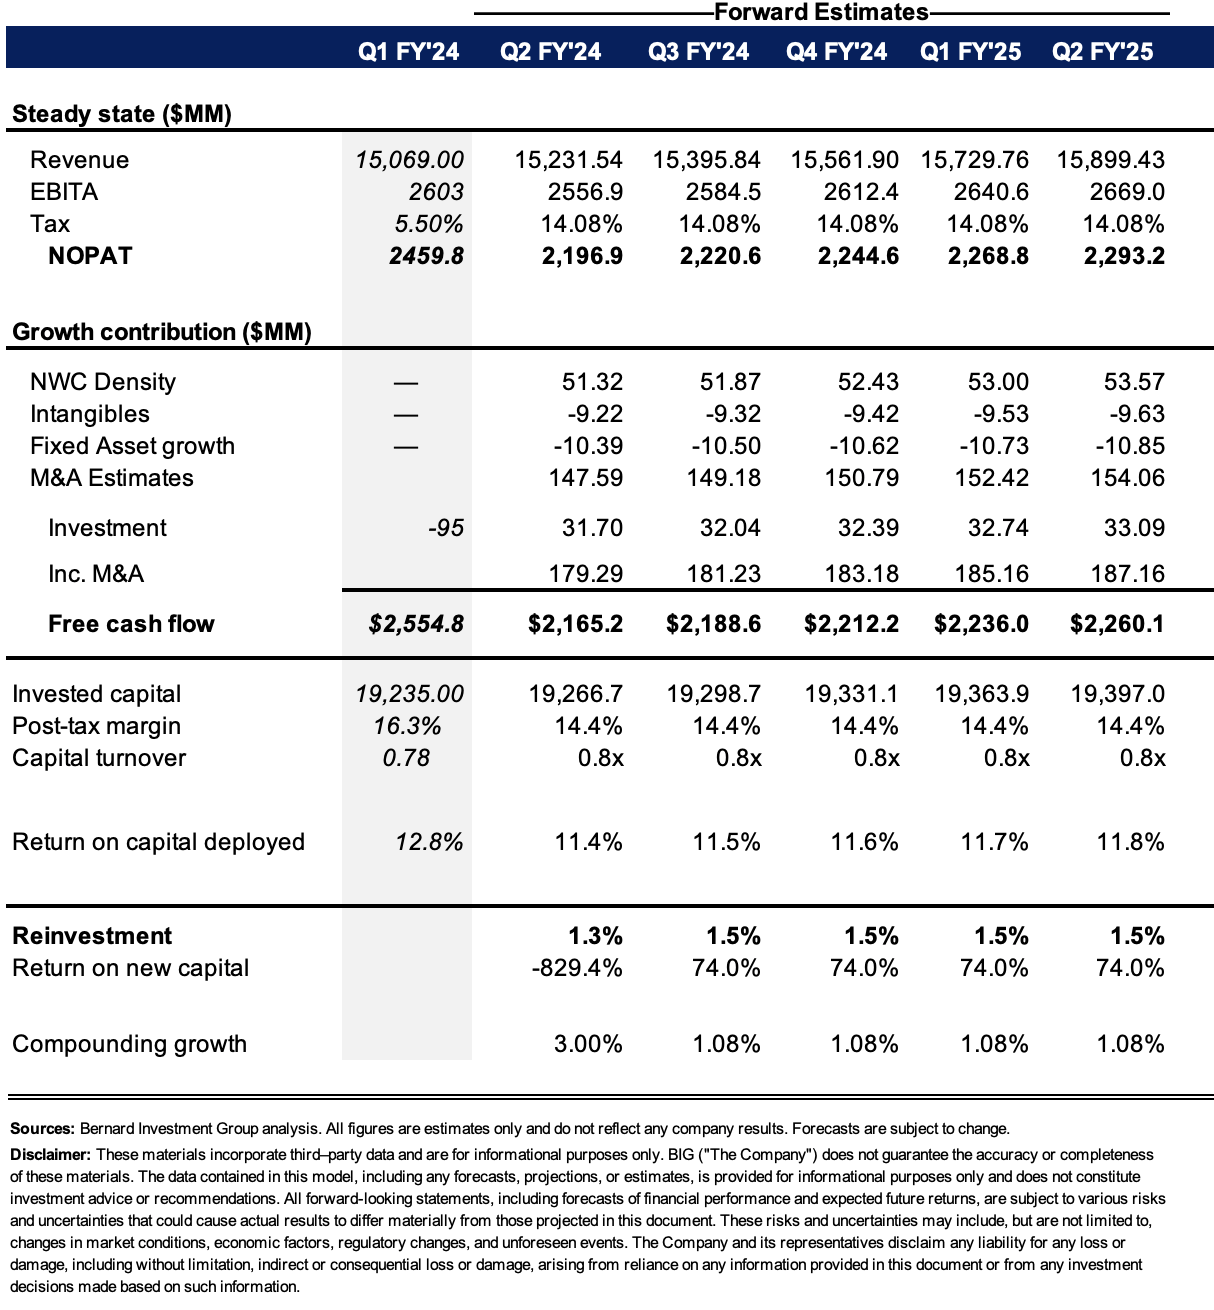
Figure 8 consolidates my forward estimates on the company over the next five years. This is produced at the company’s “steady state” of operations listed earlier but does not include potential acquisitions.
Here, I compare the projected net operating profits after tax relative to a threshold margin of 6%, which represents the current rate of return investors can earn on “passive money”, in other words, starting yields on investment-grade corporate bonds. Anything above this 6% return is considered economically valuable to me, and vice versa.
If the company does continue along its current trajectory, making minimal changes to growth and reinvestment rates, my projections suggest it could produce $5.4 billion of economic earnings – that is, those earnings above the 6% return threshold – over this period. Discounted at a 12% discount rate, (that represents the long-term market averages, and therefore opportunity cost) I arrive at a valuation of $248 per share, in line with earlier projections.
Again this illustrates why there is a large disparity in the book value of the company, that just looks at tangible assets, and the intrinsic value of the company, which discounts the surplus cash flows we could strip out of the company over the next five years. At the current market value, these economic earnings yield of 13% as I write.
Figure 8.
BIG Investments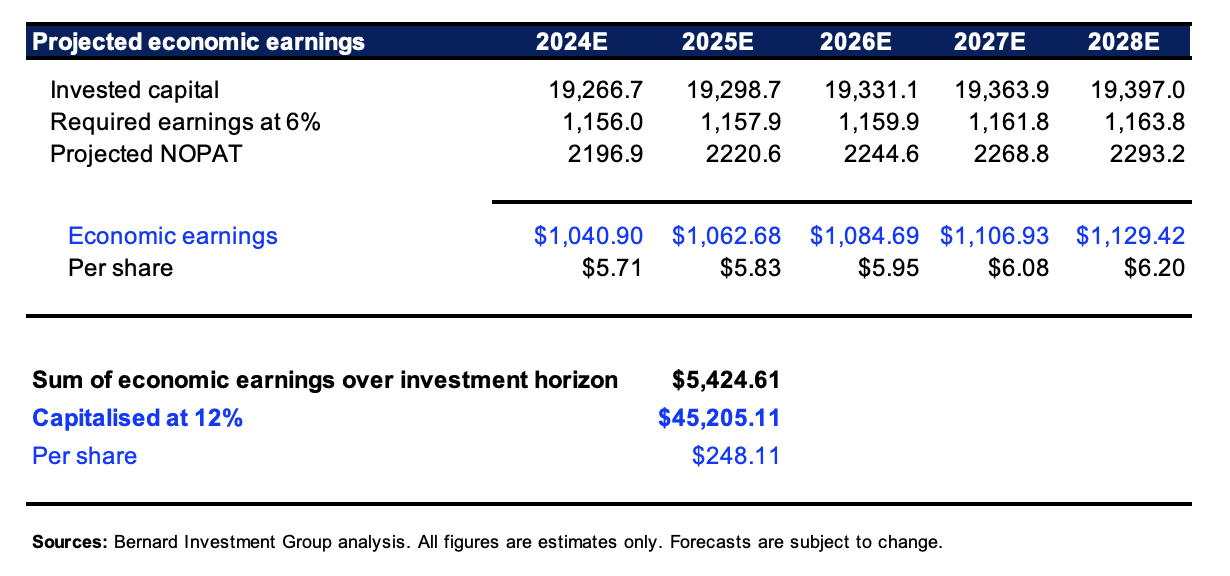
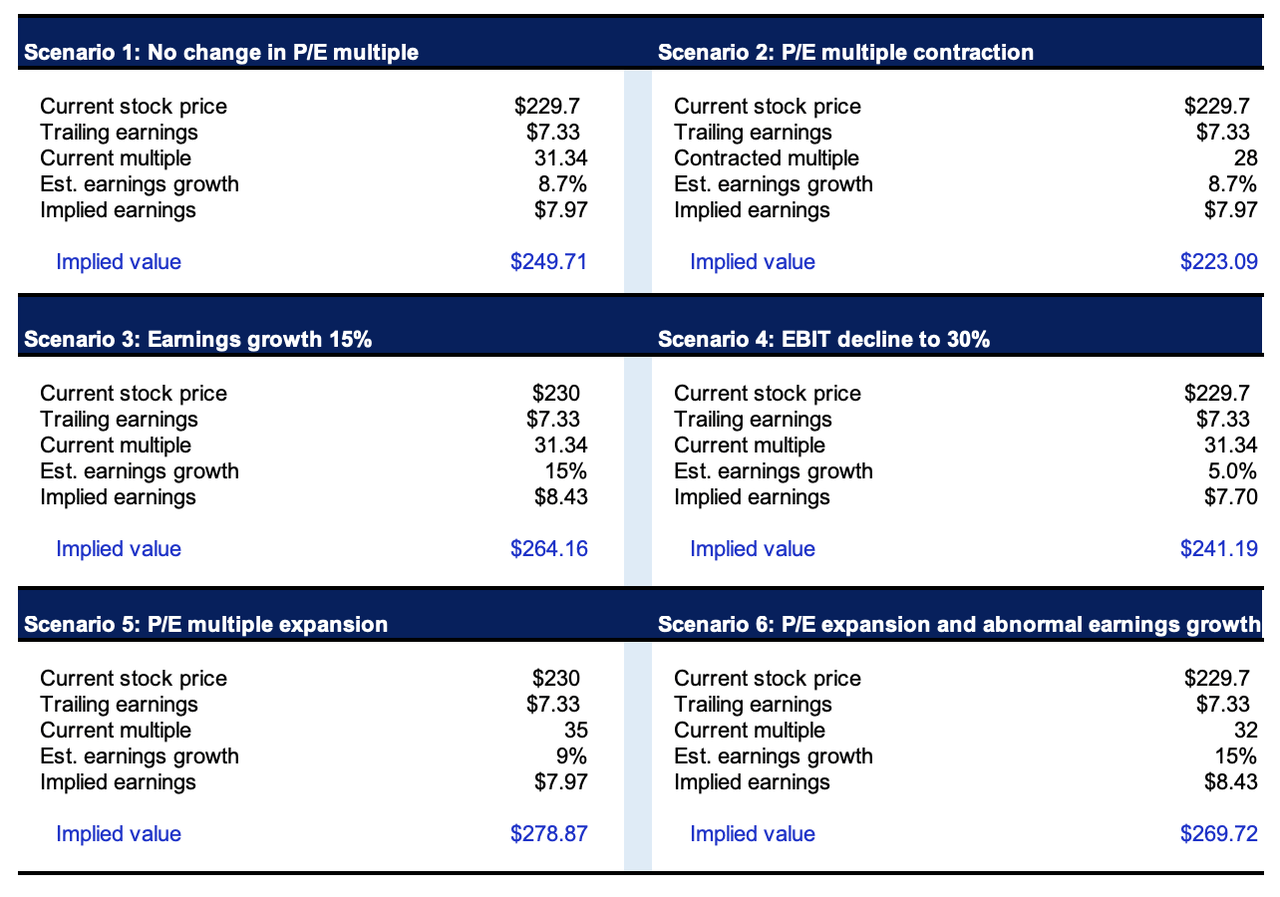
Finally, I’ve run through a number of scenarios to 1) gauge what’s driving the market multiples in this instance, and 2) how sensitive the risk/reward calculus is to change in multiple vs. earnings growth. I mentioned earlier if there’s no change in the current trailing multiple, and the company hits consensus growth rates of 8.7%, (earnings of $7.97 per share), this implies a valuation of $249 per share.
If the multiple contracts to 28x, and the company still hits its growth rates, this implies an evaluation of $223 (Figure 9). This is a 3% decline in value from an 11% contraction in multiple, so my opinion is the risk reward calculus is stacked in our favour. Say the company does not hit its stipulated growth rates and pushes out 5% instead. If investors continue paying the same multiple, the stock could trade at $240 per share.
Figure 9.
Downside Risks To Thesis
Investors must recognise the following side of risks before proceeding any further:
-
Whilst I believe it is fundamentally justified, the company does trade at high absolute multiples (31x trailing earnings). This cannot be ignored in the context of the current market environment, one where frothy valuations are apparent. Any large contraction in the healthcare sector P/E multiple could be a downside risk to the company, therefore.
-
Both management and Wall Street analysts are projecting a reasonable period of growth for the company over the next 3 year period. This is likely priced in at the current multiples in my view, and therefore, any revision to these estimates could be a factor investors might want to consider.
-
It would also be wise to factor in the fundamental drivers of the broad market in this analysis. This includes earnings growth, economic growth, valuations, and money flow. Any change to these variables, particularly on the economic growth side, may impact equities in general and therefore nullify this thesis.
Investors should realise these risks before proceeding any further.
In Short
IQV presents as a quality large-cap healthcare play with attractive fundamental economics by my analysis. This includes the company’s increasing post-tax margins, increasing capital efficiency, and exceptional free cash flow production that it throws off and reinvests successfully to produce supplementary earnings growth.
It is not unreasonable to expect these trends to continue, and for the company to continue doing what it has done for the last 3 to 5 years in a very similar fashion. Based on this view, I get to a valuation of $248 per share in my base case, and in the worst-case scenario, the stock is worth roughly what I would pay for it today, which is an excellent margin of safety in my opinion. Net-net, reiterate buy.
Appendix 1. IQV Forward estimates.
BIG Estimates