Pla2na/iStock via Getty Images
Not just housing, but other core services as well, although durable goods inflation is returning to normal.
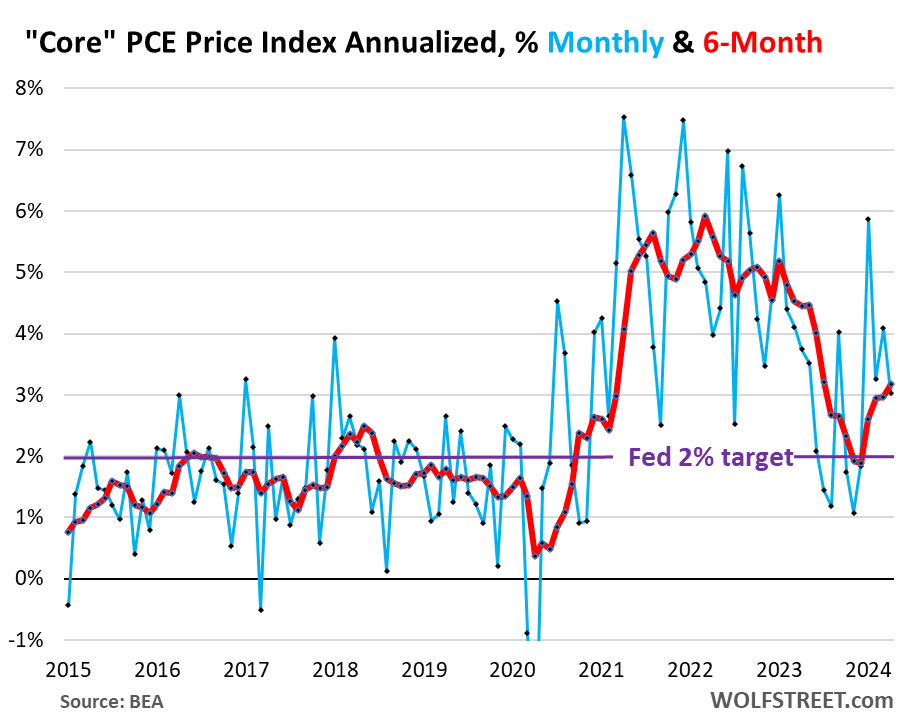
The Fed’s preferred “core” PCE price index, which excludes volatile components such as food and energy, rose 3.0% annualized in April from March (0.249% non-annualized). Data released today by the Bureau of Economic Analysis showed inflation in the second half of 2023 surpassing the Fed’s 2% target. However, while it is much higher than the second half of 2023 (blue on the chart), it is still smaller than the increase over the past three months.
The six-month annualized core PCE price index, which Powell frequently cites and adjusts for most of the erratic month-to-month fluctuations, accelerated to 3.2%, its worst increase since last July (red).
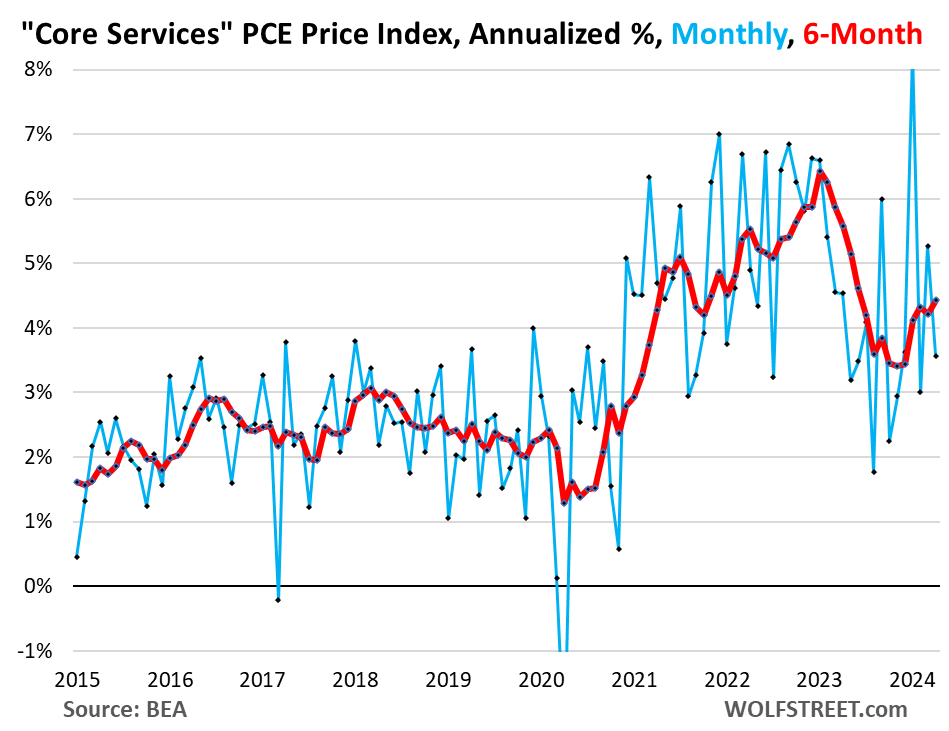
“Core Services” PCE Price Index, Excluding energy services, gross domestic product (GDP) rose 3.6% annualized from March in April (blue in the chart below).
The six-month core services PCE index rose 4.4% on an annualized basis, the worst increase since June last year.
Core services are where inflation is taking hold and where the majority of consumer spending goes. These include housing, health care, insurance, transportation services, communication services, entertainment, etc. Fed speakers mention core services constantly.
Looking at the monthly wavy line (blue), we can see how core services inflation declined from a peak in late 2022 (in the +7.0% range) to its nadir in August 2023 (+1.8%), but has since re-accelerated in a worrying way.
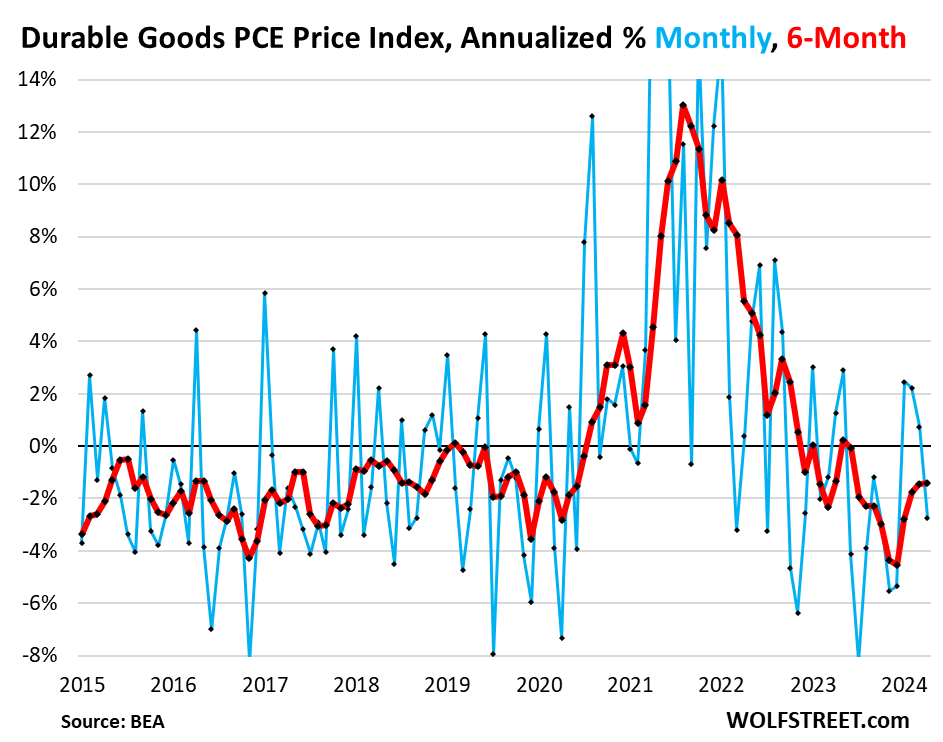
Durable Goods Inflation The PCE Price Index of Durable Goods fell 2.8% annualized in April from March (blue).
The six-month index was down 1.4%, roughly the same as the previous month (red). It tends to move in a slightly negative range under normal circumstances as manufacturing becomes more efficient and globalized. Durable goods include automobiles, home appliances, electronics, and furniture.
That means durable goods inflation is back to normal and in line with the Fed’s 2% target. The inflation problem, as we saw above, is in the services sector.
Year-on-year comparison…
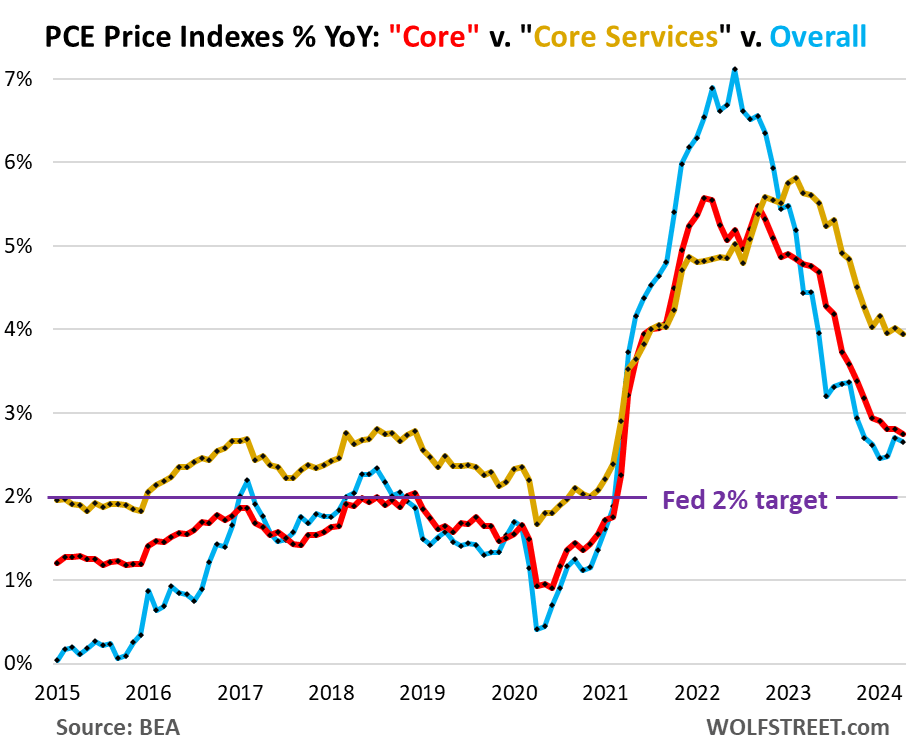
Overall The PCE price index, which includes food and energy, rose 2.7% year-on-year in April, roughly the same rate of increase as in March (blue in the chart below).
core” The PCE price index rose 2.8% year-over-year in April, roughly the same rate of increase as in the previous two months (red). The Fed’s target for this indicator is 2%.
“Core Services” The PCE Price Index rose 3.94% year-over-year in April but was little changed over the past five months. It rose 4.03% in December. As seen above, the six-month core services index has risen over 4.2% over the past three months.
Core Service Inflation Details.
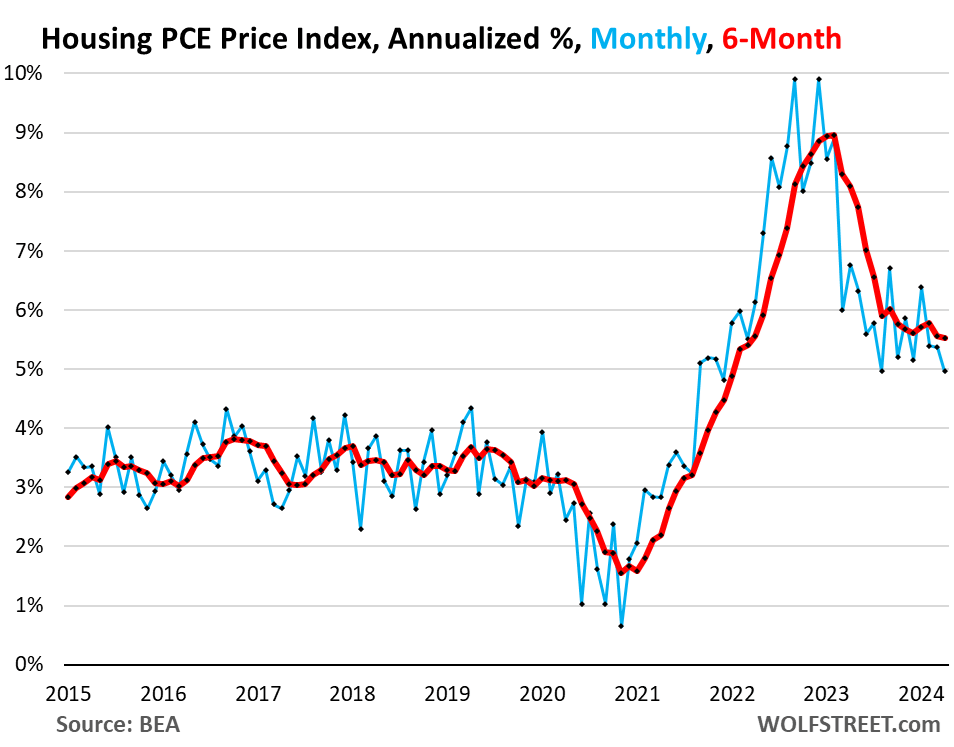
Housing PCE Price Index In April, it rose 5.0% on an annualized basis from March, slowing from the previous month but still exceeding August’s level.
The six-month index rose 5.5% on an annualized basis, roughly the same as the previous month, and has remained elevated with no significant change since November.
The housing index includes components such as rents for renter-occupied dwellings, imputed rents for owner-occupied dwellings, rental values for apartment buildings and farm dwellings.
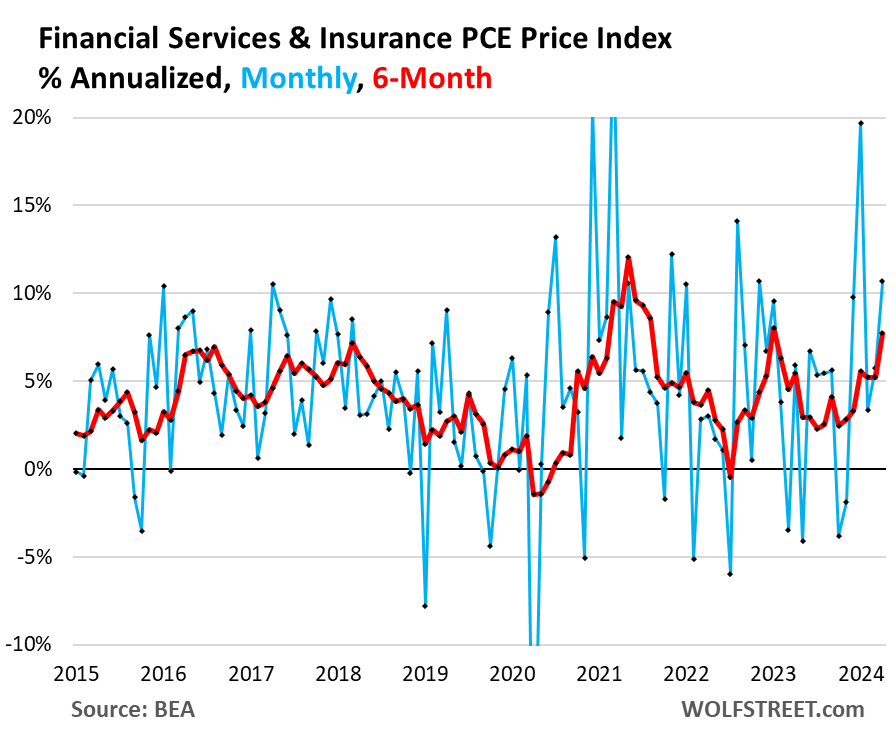
Financial Services and Insurance:
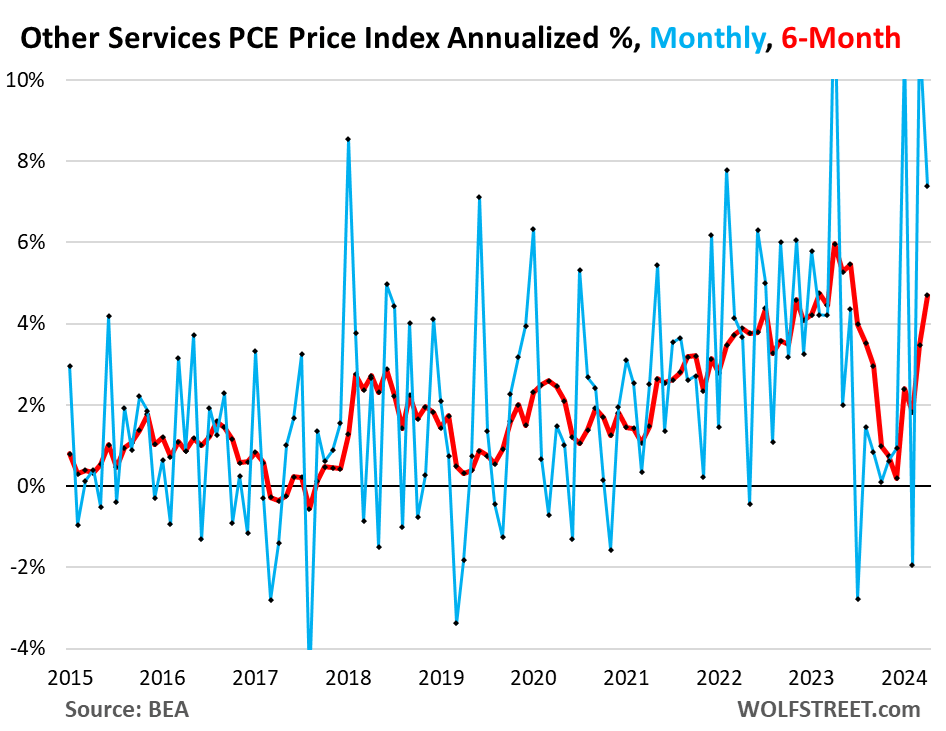
Other Core Services PCE Price Index (Broadband, mobile phones and other communications; deliveries; home maintenance and repairs; moving and storage; education and training; legal, accounting and tax services; membership fees; funeral and burial services; personal care and clothing services; social services such as nursing homes and rehabilitation services, etc.):
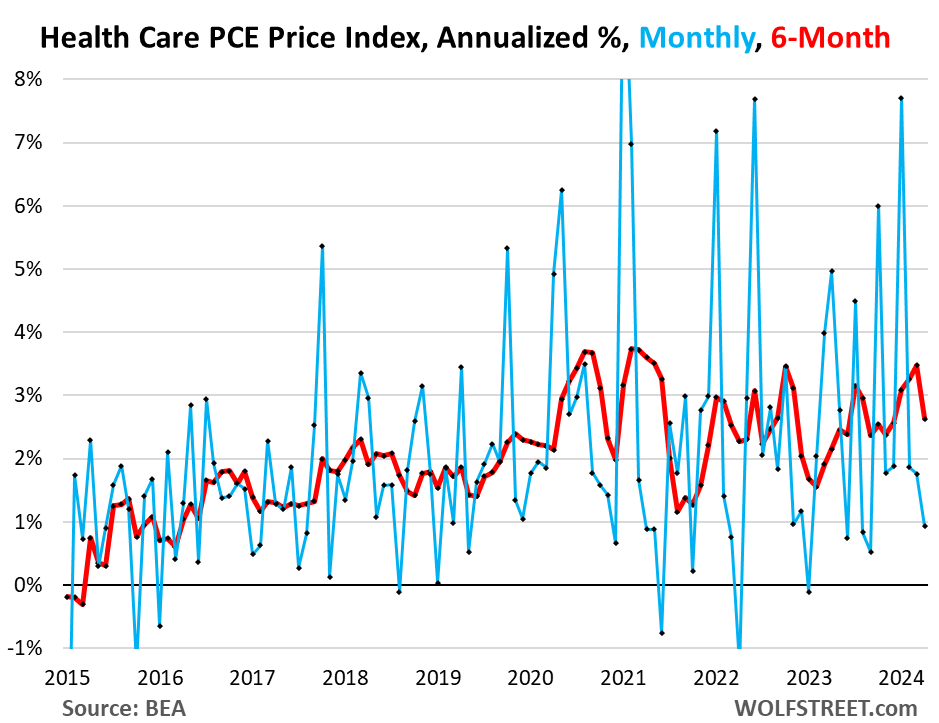
Healthcare PCE Price Index:
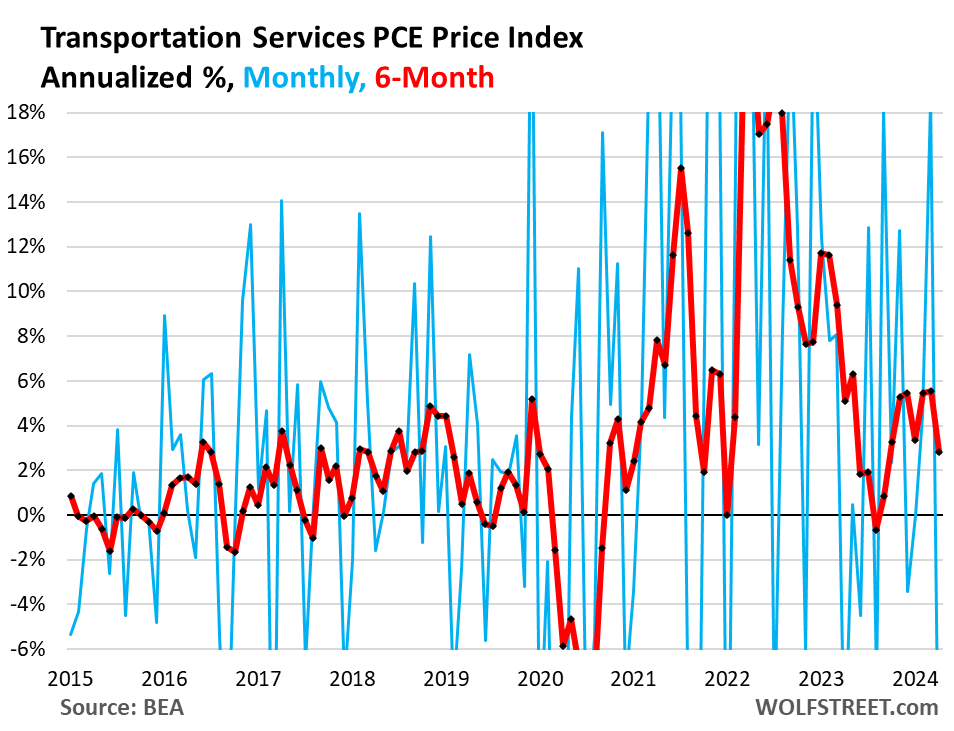
Transportation Services PCE Price Index (Auto maintenance and repairs, rental cars, parking fees, tolls, airfare, etc.) That varies quite a bit from month to month.
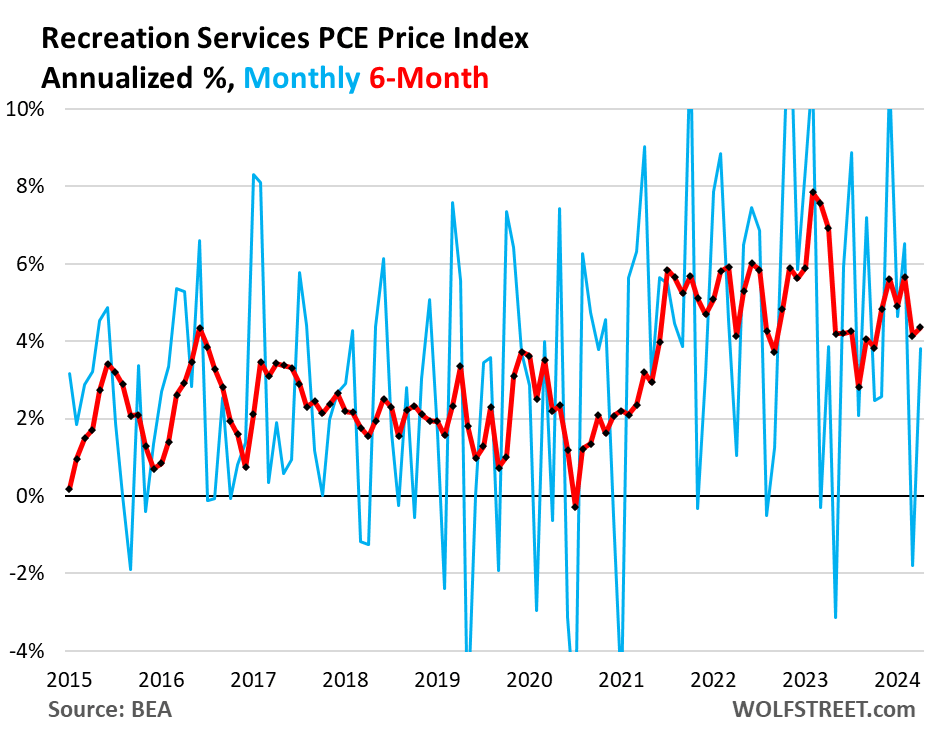
Recreational Services PCE Price Index (Cable, Satellite TV, Radio, Streaming, Concerts, Sports, Movies, Gambling, Veterinary Services, Package Tours, RV Maintenance & Repairs, etc.):
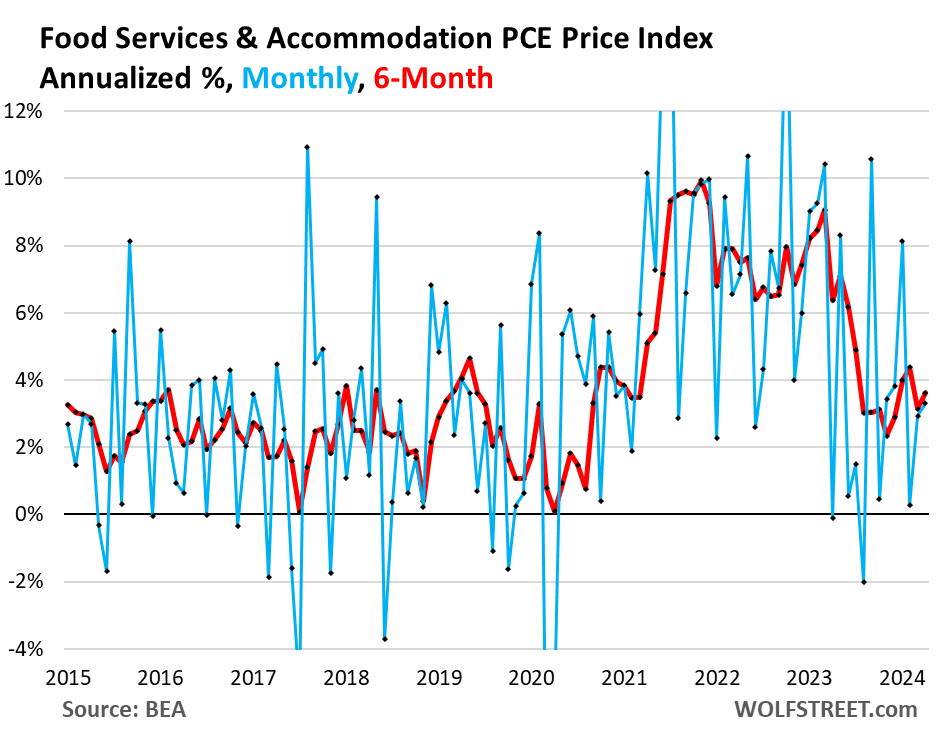
Food Services and Accommodation PCE Price Index (Restaurants, hotels, motels, vacation rentals, cafeterias, cafes, delis, etc.):
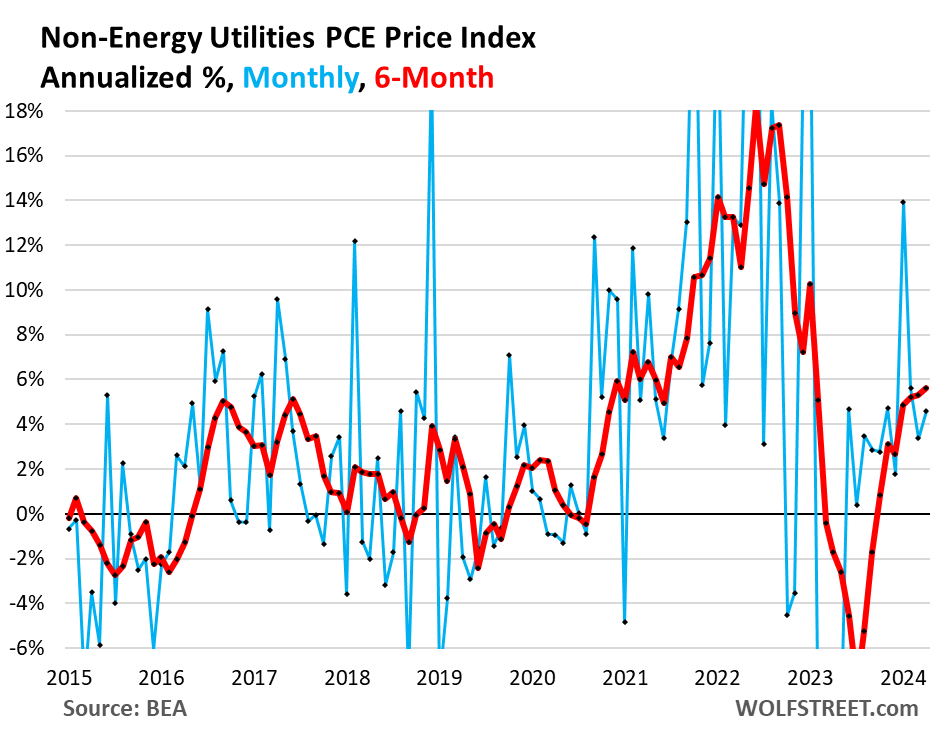
Non-Energy Utilities PCE Price Index (Sewerage, water supply and drainage, garbage collection):
Editor’s note: The summary bullet points for this article were selected by Seeking Alpha editors.

