agnormark
The Q1 Earnings Season for the Gold Miners Index (GDX) has passed and all eyes are on the Q2 results that will start getting reported in late July. Overall, the Q1 results were solid across the board with the bulk of producers reporting margin expansion and set to see further margin expansion in Q2. However, even more important than the Q1 and FY2023 results were each company’s recently released year-end resource/reserve statements. These updates provide a glimpse into how each producer is doing regarding replacing their mined depletion each year and how reserves per share are trending.
One of the first companies to release its resource/reserve update was Newmont Corporation (NYSE:NEM) the world’s largest gold company, and a significant copper producer after its recent acquisition of Newcrest Mining. In this update, we’ll dig into Newmont’s year-end reserve update, how its gold reserves and grades stack up vs. other producers and its track record of reserve growth per share vs. peers.
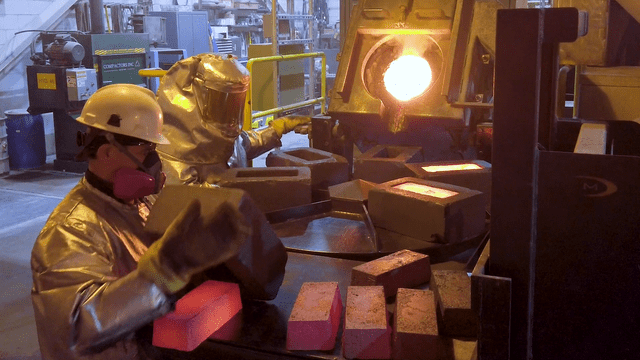
Carlin Complex Gold Pour – Barrick/Newmont
All figures are in United States Dollars unless otherwise noted. “G/T” refers to grams per tonne of gold. “M&I” refers to measured & indicated resources.
Mineral Reserves
Newmont released its year-end 2023 reserve/resource update earlier this year, reporting year-end reserves of 135.9 million ounces of gold and 30.1 billion pounds of copper. This significant growth was primarily related to adding ~44 million ounces of gold and ~14 billion pounds of copper (net of revisions) from its acquisition of Newcrest and its total gold-equivalent reserve base now sits at ~248 million ounces (including 112 million ounces of reserves from other metals like copper, silver, lead, zinc, and molybdenum). Notably, nearly 45% of its reserves are based in Tier-1 ranked jurisdictions, namely Canada, the United States, and Australia, with the remainder of its reserves within its Tier-1 portfolio in Ghana, Papua New Guinea, Argentina, Peru, Mexico, Suriname, and the DRC.

Newmont Reserve Price Sensitivity, Gold Reserves by Jurisdiction & 2023 Gold Reserves Waterfall Chart – Company Website
As the charts above highlight, Newmont added 2.8 million ounces of gold from additions, 55.9 million ounces of gold from the acquisition of Newcrest, but this was partially offset by 7.3 million ounces of mining depletion and 11.6 million ounces of net revisions. Negative net revisions were related to changes in regulatory requirements and technical assumptions and Newmont’s reserve was based on a $1,400/oz gold price assumption, which was held constant vs. 2022 assumptions.
As for total resources, Newmont has an additional ~105 million ounces of gold in the M&I category (albeit at much lower grades) and ~69 million ounces in the inferred category, translating to a total resource base of ~309 million ounces of gold. Regarding gold price sensitivity, a 100/oz increase in its reserve price assumption to $1,500/oz would increase reserves by ~6% to ~143 million ounces of gold, while a 10% increase would increase reserves to 8% to ~147 million ounces. While this certainly provides significant upside, its sensitivity is less significant than Agnico Eagle (AEM) which would see a ~17% increase in its gold reserve base using the same 10% increase in its reserve price assumptions.
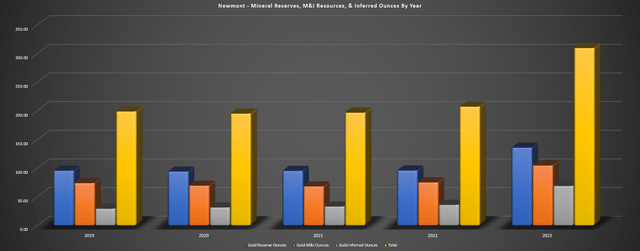
Newmont – Mineral Reserves, M&I Resources & Inferred Ounces – Company Filings, Author’s Chart
Digging into the reserve changes a little closer, Newmont reported net negative revisions of 1.8 million ounces at Penasquito, Tanami, Musselwhite and Ahafo, with 3/4 of these operations being part of its future core “Tier-1” portfolio. The net negative revisions at Penasquito were related to an updated resource model, and the site also saw a significant decline in silver, lead and zinc reserves at the mine.
As of year-end 2023, Penasquito’s reserves declined to 4.6 million ounces of gold, ~313 million ounces of silver, ~2.1 billion pounds of lead and ~4.9 billion pounds of zinc, down from ~5.4 million ounces of gold, ~346 million ounces of silver, ~2.3 billion pounds of lead, and ~5.54 billion pounds of zinc. It’s important to remember, though, that while this is a massive silver reserve base at Penasquito, 25% of silver goes to Wheaton Precious Metals (WPM) under the 2007 stream agreement at a cost of ~$4.50/oz. As for the decline in gold resources at Penasquito (~2.2 million ounces) due to updated resource model/technical assumptions that removed the resource layback at the Penaso Pit, Newmont noted that this could come back into resources based on optimization work, cost reductions, metallurgical improvements and/or metal price increases.
Let’s look at other individual assets that are in its core portfolio (*) below:
(*) Newmont’s core portfolio or the “Tier-1 Portfolio” is made up of larger and lower-cost assets on the below map separate for those it flagged as planned divestments in its 2023 year-end results. If divested, this portfolio would result in a decline of 7.6 million ounces in gold reserves from these non-core assets which make up ~5.6% of gold reserves (*)
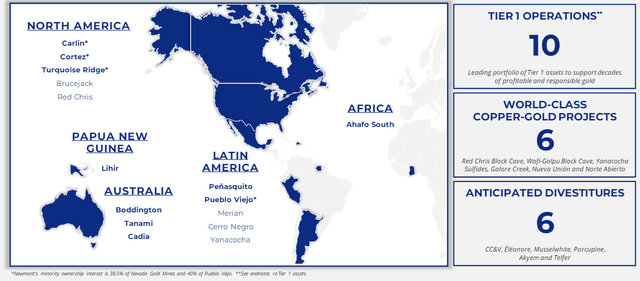
Newmont Tier 1 Core Portfolio – Company Website
Reserves By Site
Red Chris
At Newmont’s new Red Chris Mine (70% ownership), reserves stood at ~3.9 million ounces of gold at 0.60 grams per tonne of gold and ~2.3 billion pounds of copper at 0.51%, a solid addition to gold/copper reserves in a Tier-1 ranked jurisdiction (British Columbia, Canada). However, this reserve base is backed up by ~4.3 million ounces of gold and ~3.0 billion pounds of copper and there appears to be further upside to this figure longer-term. This is because Newcrest continued to enjoy immense success up until its takeover by Newmont, with high-grade hits at East Ridge and Far East Ridge (east of the main reserve area) that included 406 meters at 1.1 G/T of gold and 1.0% copper (East Ridge) and 274 meters at 0.67 G/T of gold and 0.45% copper (Far East Ridge).
As for the size of the opportunity here, Newcrest released an upper case exploration target of 500 million tonnes at 0.39 G/T of gold (6.1 million ounces of gold) and 0.47% copper (~5.1 billion pounds of copper) prior to its acquisition.

Red Chris Exploration Success & Resource Base – Newcrest Mining
As highlighted in a past update, Red Chris might not look like much of a mine today with annual production of ~39,000 ounces of gold and ~40 million pounds of copper. However, this is an asset that could support production of closer to 350,000 ounces of gold and ~200 million pounds of copper in peak years based on Newcrest’s Block Cave study released in 2021. Hence, this asset has realized nowhere near its long-term potential and while Newmont likely won’t pursue this project immediately given that it has other legacy projects in construction (Tanami 2 Expansion, Ahafo North), this is certainly an asset worth keeping a close eye on and one that could deliver meaningful reserve growth later this decade once Newmont has spent more this with this asset and is able to complete its technical studies.
Brucejack
As for the Brucejack Mine also in British Columbia, the asset ended the year with ~3.1 million ounces of gold in reserves at 8.44 G/T of gold, translating to a sub 10-year mine life assuming average annual production of ~340,000 ounces. However, it’s important to note that this reserve base is supported by ~4.5 million ounces at 10.0 G/T of gold (13.9 million tonnes) in M&I and inferred categories combined. And with this being another asset with significant near-mine expansion potential, there is certainly room to grow reserves and resources at this asset as well. In fact, just before Newcrest was acquired, the company reported that it was successful extending the high-grade HBX domain a further 200 meters to the east outside of resources, with highlight intercepts in 2023 of 1.0 meter at 1,735 G/T of gold and 1.0 meter at 5,370 G/T of gold.
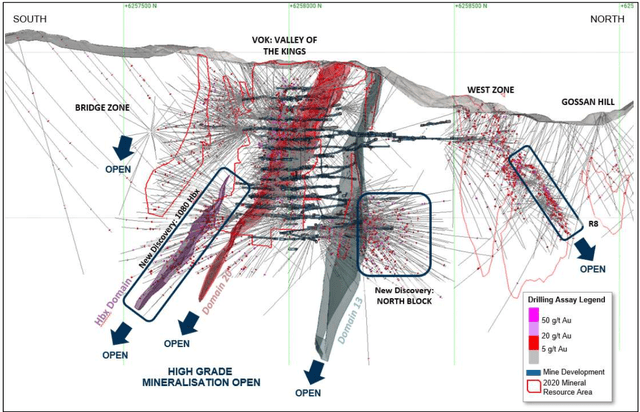
Brucejack Exploration Upside – Newcrest Mining
While the impressive hits out of North Block and the HBX Domain are certainly impressive, Newcrest stated the following before it was acquired in its March 2023 Exploration Report:
“With our increased understanding of the Brucejack mineralized system, target generation applying the knowledge gained from North Block and the 1080 HBx Zone has identified several new opportunities within the 4km epithermal gold corridor from VOK to Golden Marmot.”
– Newcrest Mining, March 2023 Exploration Report
For those unfamiliar with the regional potential at Brucejack, the upside here is quite significant from a resource growth standpoint. This is because prior to Newcrest acquiring Pretium, Pretium discovered a new zone 3.5 kilometers north of its Brucejack Mine that it named Golden Marmot. Initial drilling out of this zone hit 8.0 meters at 13.7 G/T of gold, 0.5 meters at 6,700 G/T of gold, 1.0 meters at 268 G/T of gold, and 1.0 meter at 208 G/T of gold. Follow-up drilling from Newcrest hit 1 meter at 8,000 G/T of gold (best hole to date at Golden Marmot), with continuity established over a 100 meter wide, 200 meter long and 300 meter high area. So, with upside at Golden Marmot and Newcrest confident that it might be onto new opportunities between Golden Marmot and Valley of the Kings (main mining area), there’s certainly reason to believe that this is an asset that shouldn’t have much issue replacing mined depletion over the medium-term and growing overall resources.
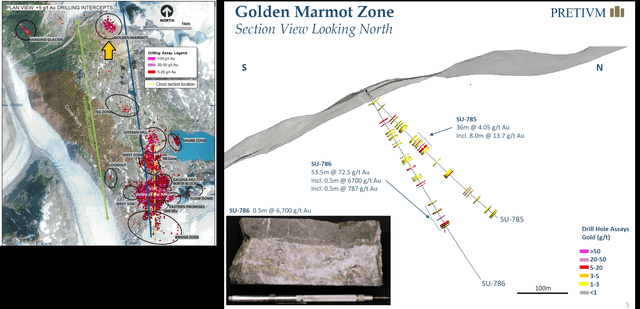
Brucejack Regional & Golden Marmot – Pretium, Newcrest
Boddington/Tanami
Moving to Boddington in Australia, reserves came in at ~9.6 million ounces of gold at 0.62 G/T of gold, down from ~10.6 million ounces at 0.63 G/T of gold in the year-ago period. This translates to a ~12-year mine life assuming average production of ~750,00 ounces, but the asset is backed up by ~4.7 million ounces of resources at 0.54 G/T of gold in the inferred category. Meanwhile, Tanami’s reserves came in at ~4.8 million ounces at 5.66 G/T of gold, down from ~5.7 million ounces at 5.34 G/T of gold. This asset is backed up by ~5.1 million ounces of gold, with resources added at Oberon UG. This large Tier-1 asset has the potential to extend production out to 2040 and will see higher production at lower costs in the 2028-2032 period with its Tanami 2 Expansion Project expected to be completed in H2 2027.
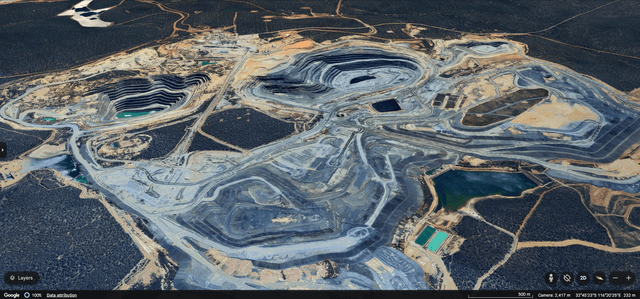
Boddington Mine – Google Earth
Cadia
Looking at its new Cadia Mine, the asset has an industry-leading mine life of 34 years, with a massive reserve base of ~14.7 million ounces at 0.42 G/T of gold and 14.7 billion pounds of copper, backed up by resources of ~20.6 million ounces of gold and ~10.3 billion pounds of copper. This low-cost asset makes up a significant portion of Newmont’s reserve base at ~$1,000/oz all-in sustaining costs. Importantly, this asset significantly increases Newmont’s weighted-average mine life at lower costs.
Lihir
The Lihir Mine in Papua New Guinea may be an average cost operation today, with gold production of ~630,000 ounces expected in 2024 at all-in sustaining costs of $1,270/oz. However, this is an asset that should see production average closer to 900,000 ounces between 2026 and 2030 at sub $1,000/oz , and peak production upwards of 1.0 million ounces of gold at much lower costs. This is because the mine plan will gain access to higher grade ore from Phase 14A. Like Cadia, this is a mine that significantly increases Newmont’s weighted-average mine life with an estimated mine life of 16 years, with further upside given that this asset has a ~17.5 million ounce reserve base at 2.51 G/T of gold, backed up by a 20.2 million ounce resource base, giving it a similar mineral endowment to Agnico’s massive Detour Lake Mine which has ~41 million ounces of total resources.
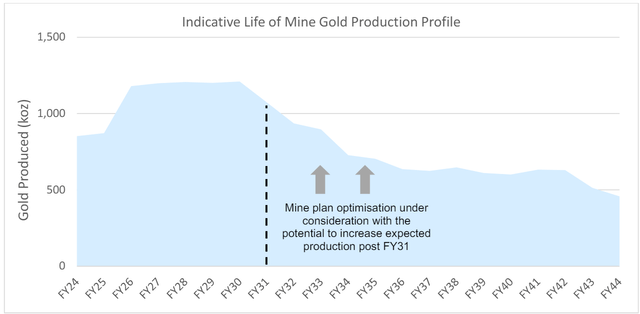
Lihir Phase 14A & Previously Projected Life Of Mine Profile – Newcrest Mining
Cerro Negro
At Cerro Negro, the high-grade mine finished the year with ~3.2 million ounces of reserves at 10.97 G/T of gold, an increase from ~3.03 million ounces of gold at 10.02 G/T of gold in the year-ago period. Cerro Negro’s cut-off grade remained flat at 4.3 G/T of gold vs. 2022 levels and the asset has a resource base of ~1.5 million ounces (~0.60 million ounces in M&I category) backing up reserves at ~4.9 G/T of gold. The asset’s current mine life stands at roughly 10 years and is expected to be extended out to 2034 with the Cerro Negro Expansion Project, with production expected to increase to 350,000 ounces of gold (FY2024 guidance: 290,000 ounces at $1,110/oz AISC).
Ahafo South
Finally, Newmont’s Ahafo South Mine in Ghana ended the year with ~5.1 million ounces of gold at a grade of 1.82 G/T of gold, down from ~5.65 million ounces at 1.90 G/T of gold with minimal reserve replacement year-over-year. Cut-off grades at Ahafo South increased from 0.63 G/T of gold (open-pit) from 0.60 G/T of gold last year, and the cut-off ground for underground reserves increased from 1.60 G/T of gold to 2.2 G/T of gold. Ahafo South has a roughly 9 year mine life, but is backed up by ~5.1 million ounces of resources, and Newmont’s overall production from Ghana will increase post-2026 with Ahafo North (300,000+ ounces at sub $900/oz costs) set to more than offset production from Akyem which is expected to be divested.
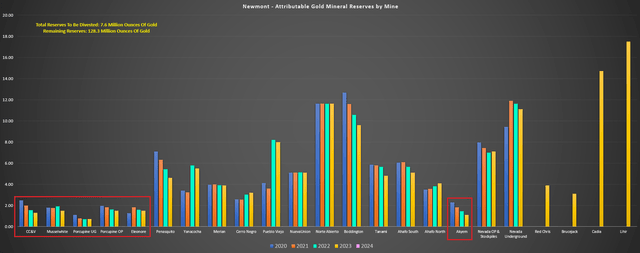
Newmont Attributable Gold Reserves by Mine – Company Filings, Author’s Chart
Overall, most of Newmont’s key managed assets continue to have relatively long mine lives and are backed up by significant resources. In addition, Newmont has maintained a relatively conservative gold price assumption of $1,400/oz and the recent gold price strength has more than offset inflationary pressures. Finally, as highlighted earlier, there is significant exploration upside at a couple of its newly acquired assets (Brucejack, Red Chris), pointing to future reserve growth. So, while I wouldn’t be shocked by reserve declines near-term with multiple assets up for sale that make up nearly 6% of total reserves, this is a much stronger portfolio today from a cost and weighted average mine life standpoint than where Newmont sat a year ago (prior to its Newcrest acquisition).
Gold Reserve Base & Growth vs. Peers
Looking at Newmont’s reserve growth vs. peers, the company’s total gold reserve stands head and shoulders above other producers, with significant growth year-over-year. Obviously, this was related to the Newcrest acquisition which resulted in industry-leading reserve growth and it would be preferable to see reserve growth without major M&A deals. Still, the Newcrest deal was an example of adding high-quality ounces vs. the Goldcorp deal that added some high-quality ounces (Pueblo Viejo 40%, Cerro Negro, Penasquito), but primarily higher-cost ounces (assets since divested or to be divested), and was overall a better deal even if a much higher price tag.
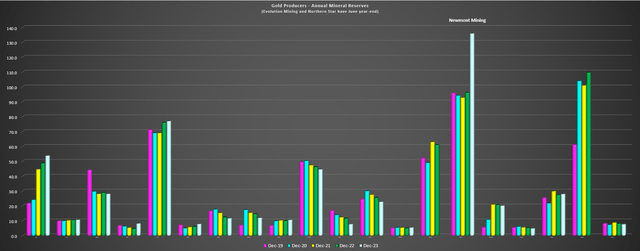
Newmont – Annual Gold Mineral Reserves vs. Peers – Company Filings, Author’s Chart
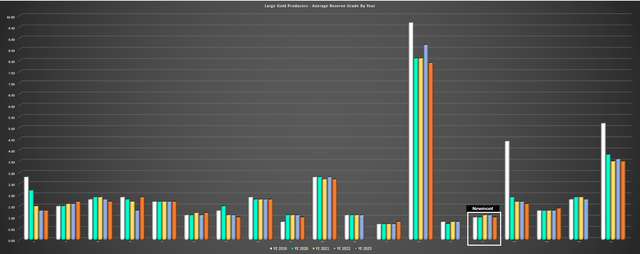
Newmont Average Reserve Grade by Year – Company Filings, Author’s Chart
As for reserve grades, we saw a further in Newmont’s reserve to 0.97 G/T of gold (2022: 1.09 G/T of gold), below that of its peer group. However, Newmont’s average copper grade increased by 20% to 0.35% (2022: 0.29%), and when factoring in copper grades with some of these being massive gold-copper (Cadia, Red Chris, Boddington) or polymetallic assets (Penasquito, Cerro Negro, Pueblo Viejo), grades are more in line with its producer peer group. Among the large-scale producer group (500,000+ ounces), the highest-grade reserves currently belong to Lundin Gold (OTCQX:LUGDF), with the runner-up being K92 Mining (OTCQX:KNTNF) at ~10.0 G/T gold-equivalent if it can increase production to 500,000 ounces with its Stage 4 Expansion (currently underway).
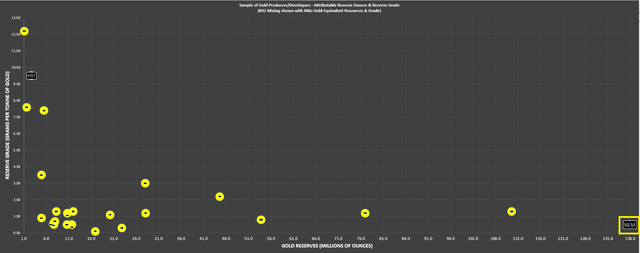
Sample of Gold Producers/Developers – Total Gold Reserves & Reserve Grade Year-End 2023 – Company Filings, Author’s Chart
Reserves Per Share
Newmont was undoubtedly successful in growing its reserves last year. In fact, it now has over double the gold reserve base of its two largest peers, which have a similar gold production profile on a combined basis. However, we did not see growth in reserves per share.
This was because Newmont’s net reserve additions of ~39.8 million ounces of gold year-over-year (41% growth) were more than offset by a ~45% increase in its share count, with ~358 million shares issued at US$37.88 as part of the Newcrest acquisition. Hence, gold reserves per share actually fell 3% year-over-year and will likely decline further in 2024. The reason is that aside from the difficulty of Newmont replacing all of its mined depletion given the size of its portfolio, it will see a ~7.6 million ounce decline in reserves from assets labeled as non-core that are held for sale. As highlighted in its-year end results, these include the following assets, with their respective year-end gold reserves:
- Telfer (resources only)
- Cripple Creek & Victor (~1.3 million ounces at 0.53 G/T of gold)
- Musselwhite (~1.5 million ounces at 6.52 G/T of gold)
- Akyem (~1.1 million ounces at 1.35 G/T of gold)
- Porcupine (~2.2 million ounces at 2.10 G/T of gold)
- Eleonore (~1.5 million ounces 5.38 G/T of gold)
- Coffee (resources only)
Even assuming successful reserve replacement in 2024, these planned divestments would cause Newmont’s gold reserves to dip below 130 million ounces at year-end 2024, and result in further declines in reserves per share and offset the benefit of any planned buybacks this year. And while there’s no question that the right move is to divest these higher-cost assets and prioritize margins over absolute production, the shedding of non-core assets and recent dilution has further dented its long-term reserve per share trend. In fact, Agnico Eagle Mines’ reserves per share have nearly doubled since 2002 and Newmont’s have been more than halved.
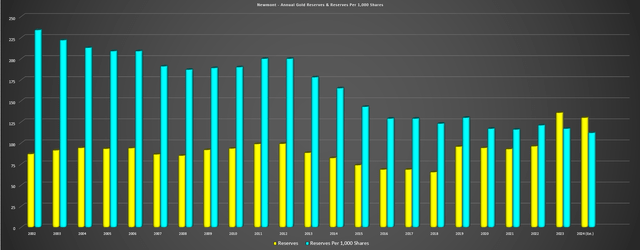
Newmont Annual Gold Reserves & Reserves Per Share – Company Filings, Author’s Chart & Estimates
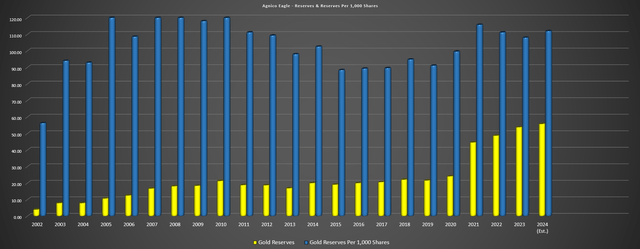
Agnico Eagle Mines Gold Reserves & Reserves Per Share – Company Filings, Author’s Chart & Estimates
In fairness, larger producers like Newmont have a far more difficult time replacing reserves and maintaining production than their smaller peers. This is because it takes larger discoveries to move the needle, and most of the major discoveries have already been made. Plus, as highlighted below, major gold producers have run into significant difficulties growing per share metrics once they hit the 6.0+ million ounce production profile mark, given that major M&A deals (that typically come with significant dilution) have been needed to sustain and or/grow production.
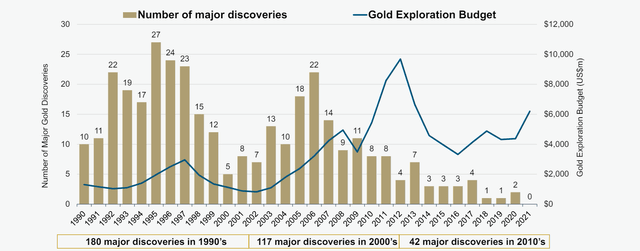
# of Gold Discoveries vs. Gold Exploration Budget – Barrick Presentation, S&P Global Intelligence
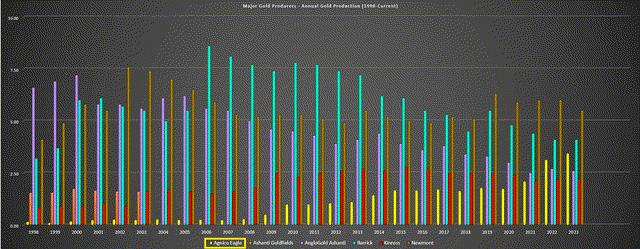
Agnico Eagle Mines vs. Other Major Producers – Annual Gold Production – Company Filings, Author’s Chart
Fortunately, Agnico Eagle is nowhere near this production level yet where it has to worry about being too big to grow per share metrics, with a production profile of ~3.4 million ounces of gold. Plus, it has the best pipeline it’s ever had to date (San Nicolas (50%), Hope Bay, Upper Beaver, Wasamac, and organic growth from its fill-the-mill strategy at Canadian Malartic and organic growth at Detour Lake with throughput increases, underground potential). Overall, this suggests that Agnico Eagle should remain a leader from a per share growth standpoint. And combined with its superior jurisdictional profile (95% Tier-1 ranked jurisdictions), industry-leading margins and more disciplined capital allocation, this explains why it has been a go-to name in the producer space and largely outperformed its peers.
Current Setup
Although the above charts certainly highlight Agnico Eagle’s dominance vs. peers helped by making highly accretive acquisitions and doing counter-cyclical M&A (Riddarhyttan (Kittila) – 2005, Cumberland (Meadowbank) – 2007, Osisko (50% Malartic) – 2014, TMac (Hope Bay) – 2021) and Newmont’s per share growth has left much to be desired, a lot of this now looks priced into Newmont’s stock. This is evidenced by it trading over 50% off its all-time highs, at a discount to its historical cash flow multiple (~7.7x FY2025 cash flow per share estimates vs. ~10.0x for its 10-year average), and at just over 1.0x P/NAV vs. closer to 1.40 – 1.50x P/NAV historically. So, while there has been little case to own Newmont from an investment standpoint and it’s made a far better trading vehicle, the current setup is far superior to the 2021-2023 period, especially if gold/copper prices can hold on to most of their recent gains.
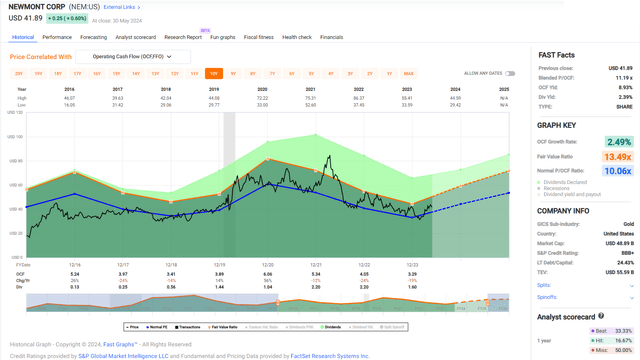
Newmont Historical Cash Flow Multiple & Current Multiple – FASTGraphs.com
Plus, for investors that are bullish on the gold price, Newmont’s FY2025 free cash flow yield would trade at just ~11x free cash flow estimates at $2,450/oz gold, far cheaper than its FY2020 free cash multiple of ~16.6x at its peak in August 2020 when it topped out at $72.00 per share (~$58 billion market cap vs. ~$3.5 billion in FY2020 free cash flow). Hence, in both base case ($2,200/oz) and upside case scenarios ($2,450/oz), there looks to be higher prices on deck for Newmont over the next 18 months. Plus, as operating costs decline and the company improves productivity to its more streamlined Tier-1 portfolio, we should see even further free cash flow generation in 2026, even if the gold price only holds at current levels.
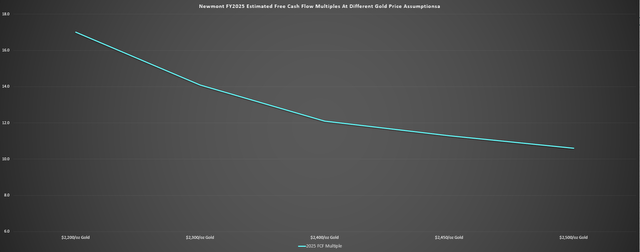
Newmont FY2025 Estimated Free Cash Flow Multiples at Different Gold Price Assumptions – Company Filings, Author’s Chart
Overall, this improved outlook for free cash flow generation near-term and medium-term suggests that any sharp pullbacks in the stock should provide buying opportunities.
Summary
Newmont had a satisfactory year of reserve replacement, with net negative revisions and limited resource conversion offset by significant reserve/resource additions from the Newcrest acquisition. Unfortunately, gold reserves could remain under pressure year-over-year with multiple non-core assets held for sale, but aside from the hit to reserve growth per share, Newmont will a much stronger, longer-life and higher margin portfolio today and be able to direct capex and attention to its best assets.
Given Newmont’s shift to focusing on producing the highest margin ounces vs. maximizing production, I see a much improved medium-term outlook and I would view any sharp pullbacks in the stock as buying opportunities. That said, I continue to focus on more attractive bets elsewhere in the sector currently with 70% – 90% upside to fair value.

