Matteo Colombo
Investment Thesis
Now that we are almost through the Q1 2024 earning season, sector-specific growth numbers are available for analysis. The median S&P 500 stock grew earnings 7% year-on-year in Q1, as seen in Figure 1, however the distribution of this was highly skewed. For instance, utilities and communication services increased earnings by 30% and 38% as a group respectively, but healthcare and materials company’s saw a 26% and 21% decline in bottom-line growth as a group respectively (see more here).
The industrials sector has stood out in 2024 a quality segment in a frothy broad market, one that has seen its P/E multiple increase back above 21x.
In late 2023, we had advocated for a tactical rotational to the industrial sector. So far, we have been pleased with a number of picks made.
Figure 1.
Source: Goldman Sachs Investment Research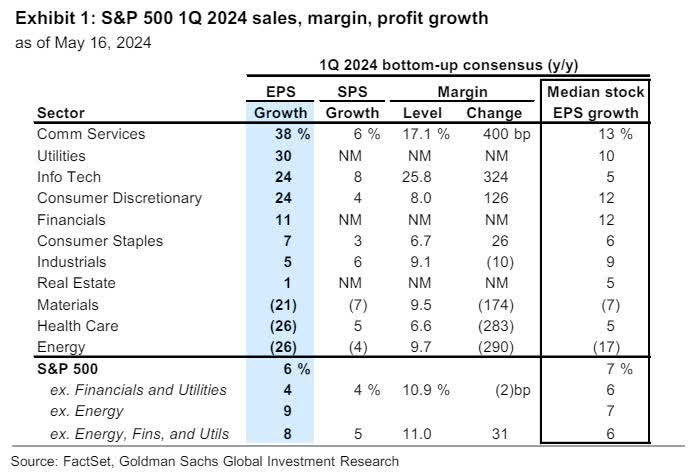
Investors are paying decent multiples for companies exhibiting “quality” characteristics, exemplified by 1) high returns on capital, 2) strong free cash flow production and 3) low interest rates sensitivity. In fact, the performance of unprofitable stocks in the 3000 Index has lagged the broad market this YTD, as evidence of this.
Figure 2.
Source: Goldman Sachs Investment Research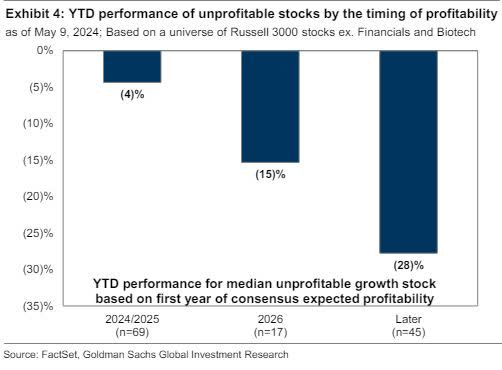
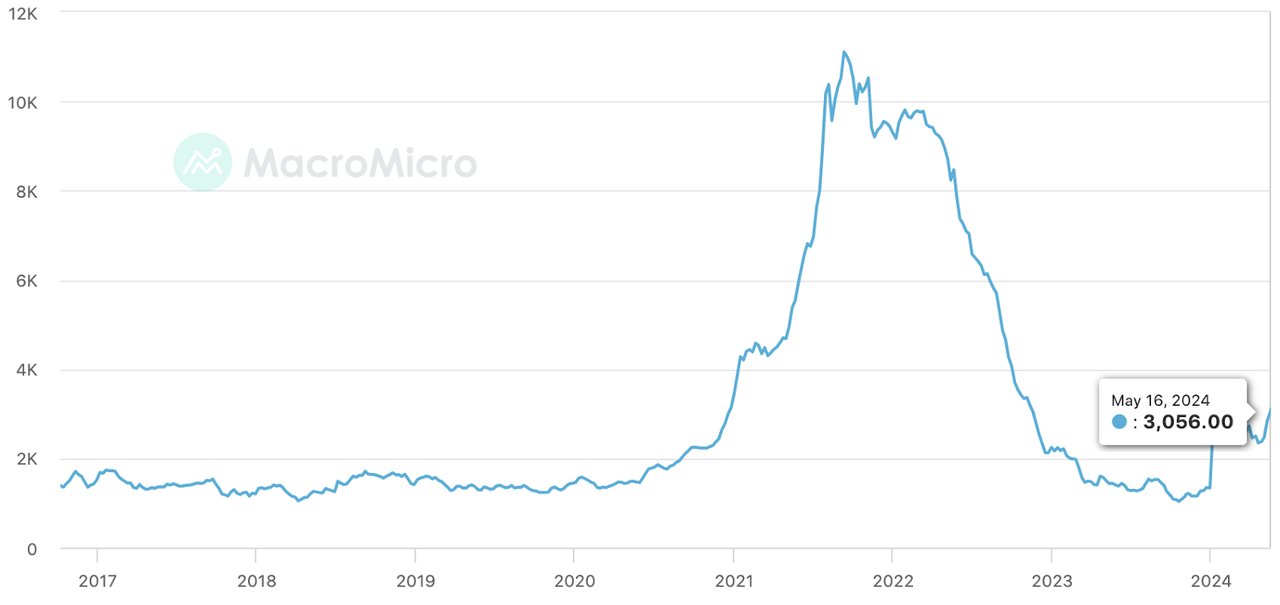
From a top-down perspective, the marine transportation industry currently has a number of cyclical tailwinds behind it, making it an attractive domain for security selection. The Freightos Baltic freight Index, a measure of daily freight rates used by corporations and investors worldwide, has curled up from 2023 lows and is now above pre-pandemic range (Figure 3).
This is critical for players within this industry, given it is a highly undifferentiated playing field, therefore revenue volume and operating margins are the two major factors to focus on for intercompany analysis. With freight rates ticking higher, it stands to reason the revenues for marine transportation company’s may enjoy the same experience.
Freightos Baltic Freight Index
Investment Summary
From a bottom up perspective, our analysis has pointed to Navios Maritime Partners L.P. (NYSE:NMM), a company that operates its own dry cargo vessels throughout Europe, Mediterranean, Asia, North America and Australia. NMM is heavily involved in the seaborne movement of dry and liquid cargo, predominantly crude oil, refined petroleum, iron ore, and so forth.
The company produced revenues of $1.31 billion in 2023, an enormous stretch from the $219 million it generated in 2019. It pulled this to earnings of $12.45 per share, again well higher than its pre-pandemic numbers of $2.43 per share.
NMM appears differentiated from competitors on a number of levels, and we can see this explicitly in the data. I will run through this in greater detail today. Primarily, the company enjoys pre-tax margins of 33.06% (TTM figures), above the maritime industry average of 23.8%.
This is critical: given the capital intensive nature of the industry, companies do not realise an abnormally high turnover on their invested capital, relying on after tax margins to drive business returns instead.
Key risks
The key risks to owning NMM stock today is the company’s complex organisational structure, along with its convoluted tax treatment. We can see in the table below.
|
Company |
Navios Partners |
|
Formation Date |
August 7, 2007 |
|
Legal Structure |
Limited Partnership |
|
Jurisdiction |
Republic of the Marshall Islands |
|
General Partner |
Olympos Maritime Ltd. |
|
General Partner Ownership |
Approximately 2.0% |
|
Business Activities |
Seaborne transportation of liquid and dry cargo commodities |
|
Cargo Types |
Iron ore, oil, coal, grain, fertilizer, containers |
|
Charter Types |
Short-term, medium-term, long-term |
|
Management Offices |
Greece, Singapore, Monaco |
Source: Company filings
The company has jurisdiction in the Republic of the Marshall Islands, it is instructed as a limited partnership, and the general partner is Olympos Maritime, with its management offices located in Greece, Singapore and Monaco.
I will touch more on some of the complexities in the company’s organisational and tax structure at the beginning of the analysis. But for now, the economics of the business appear attractive, and warrant a valuation well above the 3.5x earnings and 5.6x forward EBIT it currently sells at in my view – 81% and 65% discount to the sector of respectably. In fact, the company is heavily discounted across all relative multiples, and this represents a buying opportunity in my view.
Here I will cover all the moving parts in the NMM investment debate, the benefit of investors own reasoning.
Figure 3.
Source: Bloomberg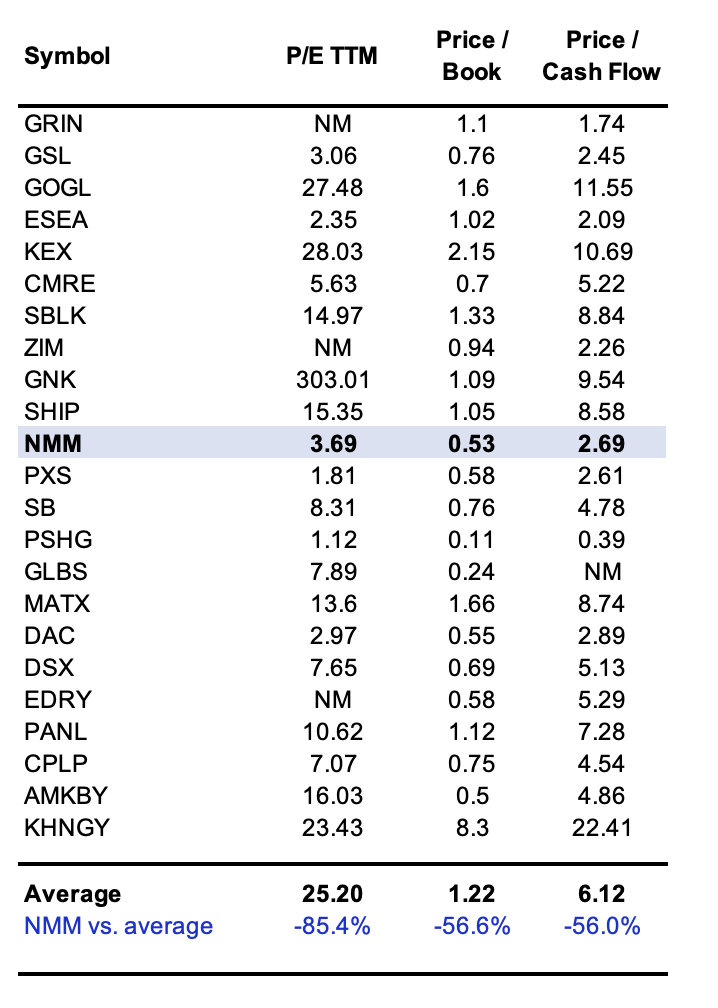
Complex organisational and tax structure
Overview of operations
There is actually a fair bit to wrap your head around here, and it is important to do so in the context of understanding the company’s value proposition.
The company was formed in 2007 with legal jurisdiction in the Marshall Islands. The general partner is Olympos Mary (“OM”) as mentioned earlier. OM currently owns all the general partnership units, which amounts to around 2% ownership in the whole entity.
NMM boasts deep custom networks with some of the largest multinational companies in the world, as seen in the table below. This is a competitive advantage in my opinion, one that is exacerbated by the diversified customer group.
|
Customer |
|
ZIM Integrated Shipping Services Ltd. |
|
HMM Co. Ltd. |
|
Chevron Transport Corporation Ltd. (“Chevron”) |
|
Unifeeder ISC FZCO “) |
|
COSCO Shipping Group |
|
VS Tankers FZE/AMPTC |
|
Saudi Aramco |
|
Nippon Yusen Kabushiki Kaisha |
|
Kawasaki Kisen Kaisha Ltd. |
Source: Company filings
In addition, NMM’s current fleet looks in good shape based on my analysis. Key projections for the company’s operations are noted in the tables below.
Management expect an average daily net rate of $24,910 across 35,561 fixed days for the year. On this, expects $885 million in total contracted revenue for the year, against cash expenses of $895.8 million.
Figure 4.
The fleet has vessels across all ranges of 0 to 20 years, with the highest distribution of vessels around 10 to 15 years old. Critically, of the company’s total fleet of 176 vessels, 27% of these ships are in the newly built (“NB”) to 5 years old range. Moving forward, NB deliveries in 2024 and ’25 will be equivalent to ~17% of the fleet. This would equate to a 9% YoY growth in fleet size. It aims for another 5% sleep growth in 2025.
Figure 5.
Source: Company filings
Management is aiming for a $1.6 billion capital investment as part of its new building program (2024-’25), comprised of an $885 million investment in new tankers and $735 million investment in container ships. On this, it hopes to build 26 vessels, 16 tankers and 10 container ships respectively.
The average expected investment is $73.6 million for container ships, $55 million for tankers, and around $61.5 million per vessel on average for the program.
The maritime transportation industry’s average return on total capital is around 5.5%. If NMM’s management is to beat this amount, it would need to produce a minimum $96 million in additional earnings to achieve a 6% return on these investments.
Figure 6.
Source: Company filings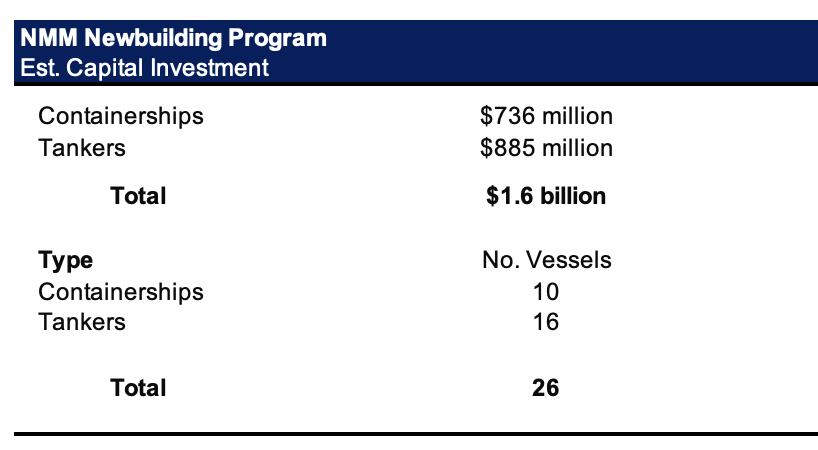
Organisational and tax structure
One of the challenges I foresee in owning the stock is the company’s organisational structure. As I’ve already mentioned, there are several moving parts to the company’s make up.
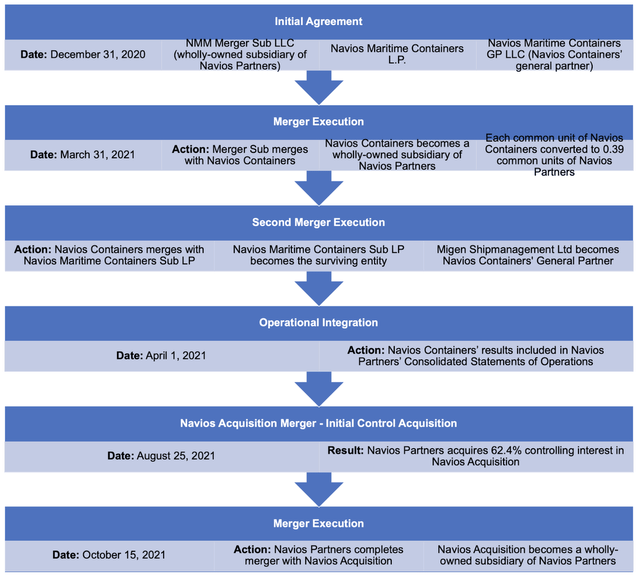
A flow chart of the Navios Partners and Navios Containers merger is seen below. As you can see, there is quite a bit to it. Starting in 2020, the original entity underwent a substantial transformation to consolidate its operating lines under one banner. The two entities were eventually rolled into a
single unit, where Navios Containers became a wholly owned subsidiary of Navios Partners.
Figure 7.
Source: Company Filings
Normally, this kind of restructuring, nuanced as it is, is part of regular corporate activity and is no course for concern. The issue here in my opinion is the company’s jurisdiction in the Marshall Islands. This creates an interesting tax situation that may end up being investor-specific, so I would advise talking to your respective tax advisor before making any commitments of equity to this name.
There are several risks investors must consider in the corporate tax debate for NMM. The other factor is that unit holders in the US may be subject to income tax in more than one domicile, including Greece, where the company has a major set of its operations. There are other risks seen and summarised in the table below, but the point is, these are not the typical set of risks investors would normally need to consider when purchasing investment securities on the open market through a US exchange.
The fact this complex tax and organisational structure exists cannot be overlooked and must be factored in on an individual circumstances level.
Source: Company Filings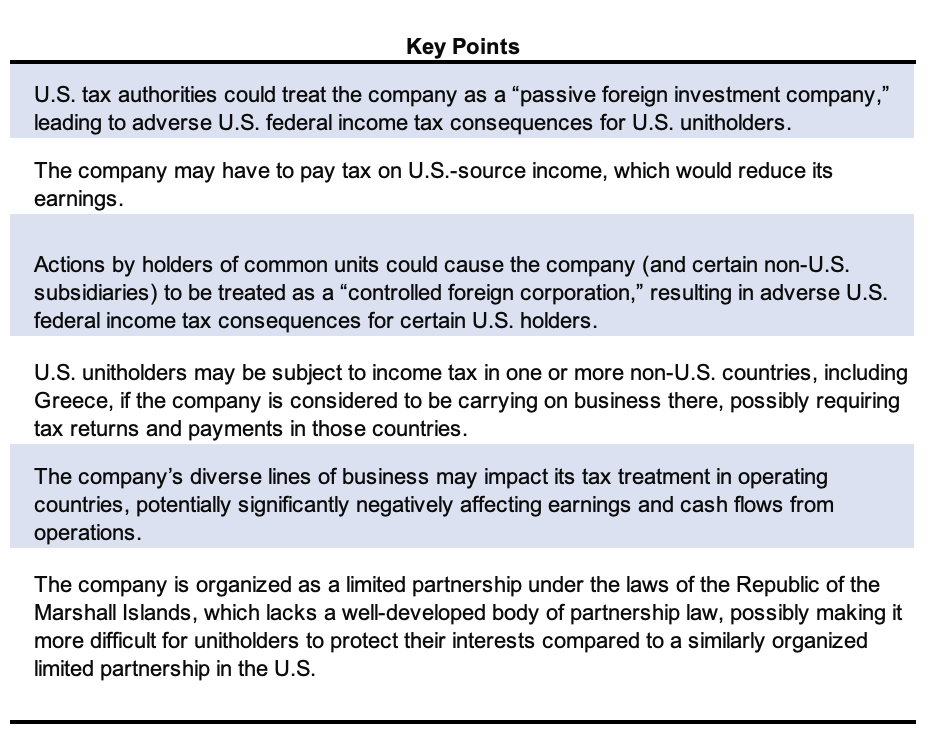
Fundamental economics driving value
The marine transportation industry is a capital intensive one, where large sums of cash must be committed each year in order to maintain a competitive position. Furthermore, the industry suffers from so-called “commodity economics”. This is classified as a service or product, that is undifferentiated in any customer in an important way by factors such as appearance or service. In that vein, all the companies in maritime transportation are selling “freight/shipping”, and it is hard to differentiate on this service.
The only way to differentiate is through:
(i) production or cost advantages which allow you to sell/price lower than peers; or,
(ii) consumer advantages, offering a higher price and therefore operating margins than peers.
Businesses with commodity type economics incur many challenges. When substantial excess supply already exists in the market, buyers don’t care about product or distribution choices. It all comes down to price, as mentioned. These types of corporations must lower their costs to competitive levels, or they will face annihilation. If they do not have high profit margins, slow capital turnover inevitably produces inadequate returns for both the business and its owners.
Corporations can increase their volume or improve their profit margins through various ways. But the problem is, all of their competitors are likely doing the same thing. It therefore comes down to a function of post tax margins and capital turnover for NMM.
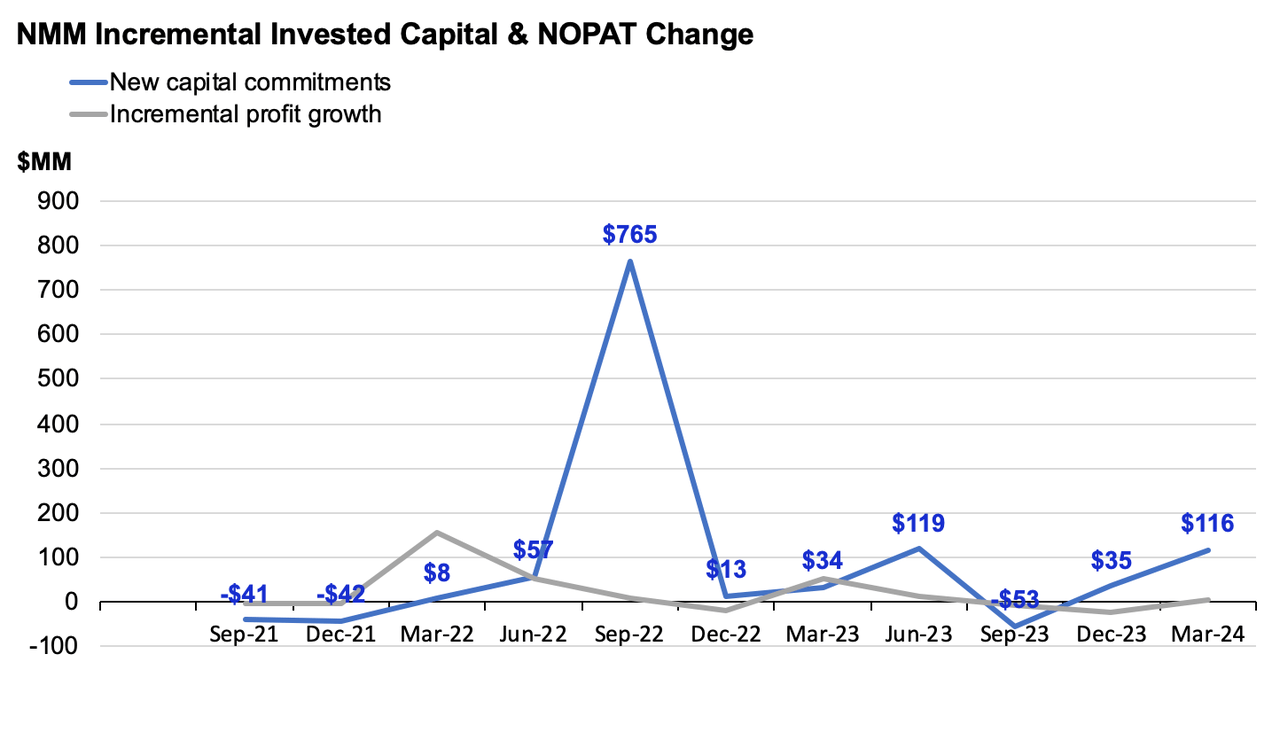
Turning to the exhibit below, one can observe the outcome of management’s capital allocation decisions. Shown in per share amounts, from Q3 ’21, it has grown net operating profit after tax by $34.13/share off a $7.56 per share additional investment (TTM figures). This represents a 451.5% incremental return on new capital deployed in the business.
Figure 8.
BIG Investments, company filings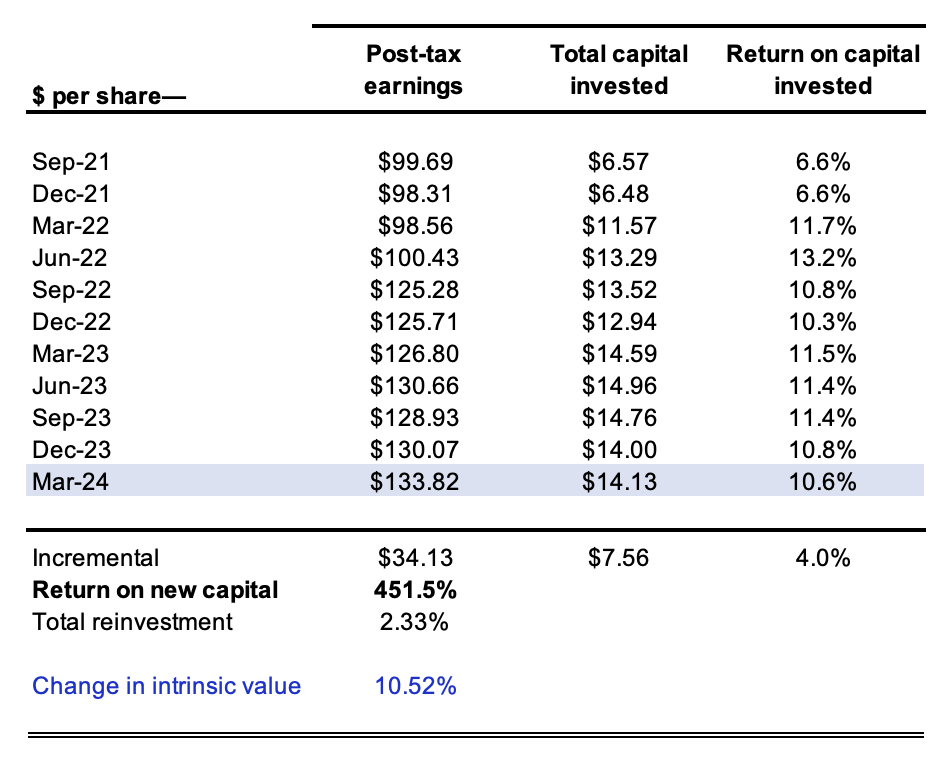
However, it is more nuanced than this, as we will discover. Firstly, the company has not had exciting reinvestment opportunities to plough these earnings back into. The “reinvestment rate” of these profits was just 2.33%.
Secondly, it would appear that the gains in profitability have been a function of the marketplace, rather than any company-specific driver. This is typically the case in commodity type industries, where price increases are typically brought on by conditions of short supply, and quickly normalise. We see this in the Baltic freight Index from earlier, where freight conditions improved quite rapidly after the large increasing price throughout 2022. However we also see this in the company’s case. Earnings have increased each period since 2021 on a rolling TM basis; however, the post-tax margin has remained relatively flat in the low 30 to 35% range.
Figure 9.
BIG Investments, company filings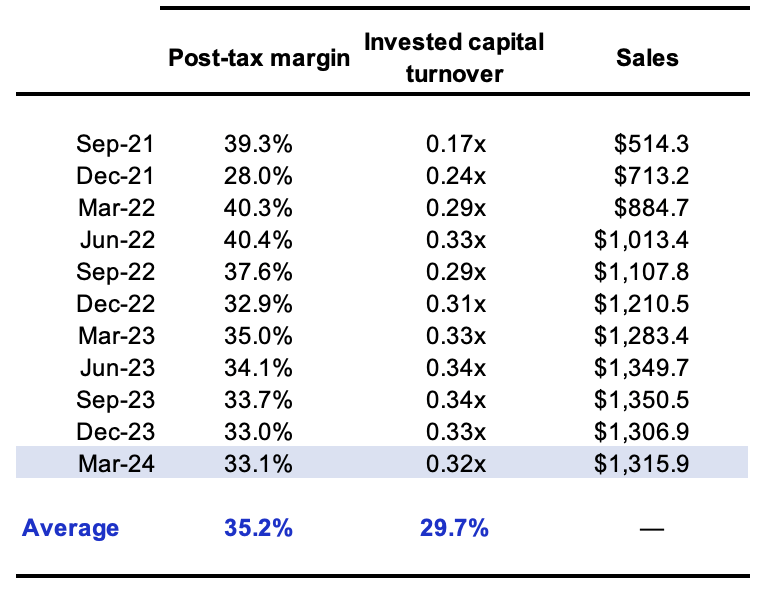
These margins are above industry averages as mentioned earlier, and suggest to me that the company may possess a competitive advantage, pricing its offering slightly higher than the industry average, and therefore realising the higher margin.
We see this explicitly higher up the P&L as well, with accompanies trailing gross margin of 82% against industry averages of 47.5%. This tells me the company has a lower cost of service, and is likely pricing its offerings above the industry.
The consumer advantages appear a unique consumer relationship/advantage with major suppliers of petrochemicals, fertilisers and so forth around the world. Given the sensitive nature of these relationships, it is not surprising to see NMM clip a higher margin. In my opinion, this competitive advantage is represented statistically in the company’s higher than average returns on invested capital.
Analysis of management capital budgeting
In view of the recent industry tailwinds, (i.e. freight pricing), I wanted to get a deeper view on how management has been growing revenues and profits over the last few years.
Seen below are the drivers of the company’s growth. What shows is a period of high sales growth, and tremendously strong margins of 35%.
The key finding, however, is that each new $1 of revenues across the last three years has required $1.31 investment of capital to achieve. Unsurprisingly, the bulk of the company’s capital allocation has been towards its fixed asset base, which it classifies as property plant and equipment, in addition to around $0.62 on the dollar for investment to net capital. This latter is rather surprising, especially as the company has enjoyed negative networking capital for the last two years.
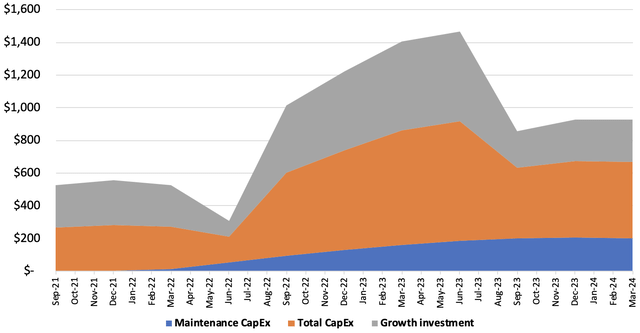
The point being that every $1 of revenue growth has required substantial reinvestment of capital, squaring off with the economics of this business. I mentioned earlier this is a capital intensive industry, and large commitments must be made each year in order to maintain a competitive position. Even the maintenance capital expenditure charges are tremendously high. If we were to approximate this as the level of rolling depreciation each TTM period, we see that NMM requires around $205 million of maintenance investment to continue operating.
What is encouraging, though, is that management appear to be investing heavily for growth. For instance, since 2021, the company has invested more than $100 million at a minimum over its maintenance threshold (Figure 11). In the last quarter, for the trailing 12 months it invested $261 million of what I would call “growth investment”, which is a good sign given the factors discussed so far.
Figure 10.
BIG investments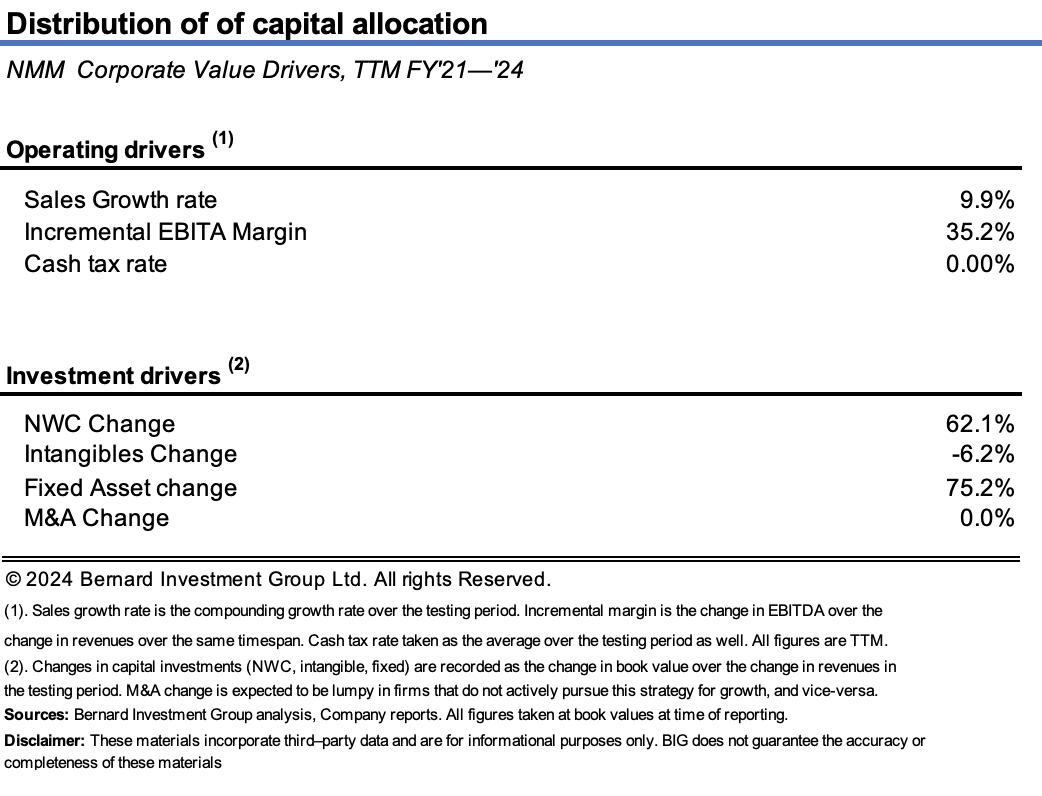
Figure 11. NMM growth vs maintenance CapEx
Figure 12.
Valuation drivers
With the stock trading at single digit multiples of earnings and EBIT, one has to immediately question if this is a statistical discount, or if the market is correctly pessimistic.
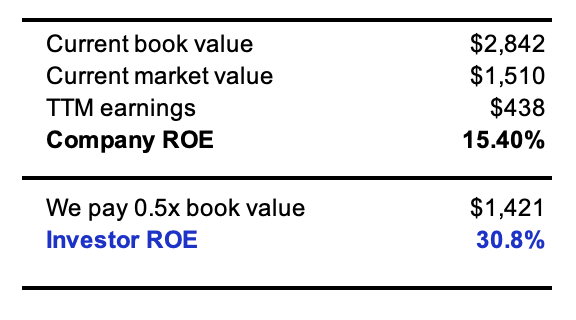
Firstly, management produced a trailing return on equity of 15.4% in the last earning cycle.
The stock is also priced at 0.5x book value, and with our discussion so far, to me, this is a statistical discount. Consider the following points:
-
NMM is a better operation that we could develop, or better than what we might negotiate in buying a whole company of similar nature,
-
It is selling at a price where the equity interest can be purchased at a substantially less value (50%) than the value to replace its net assets,
- It has $92 in book value per share as I write, more than double its market value,
-
The company’s economics indicate that the offered purchase price is, in fact, a discount given the high returns on capital and free cash flow of $10.60 per share and the trailing 12 months.
The following mathematics also explains the statistical discount:
The current return on equity is 15.4% on a book value of $2.84 billion. We are asked to pay 0.5 times that amount, otherwise $1.42 billion. This is less than the company’s current market value.
Because we pay this discount, and presuming no growth in earnings moving forward, our return on equity lifts to 30.8%, evidencing the statistical discount on offer.
Figure 13.
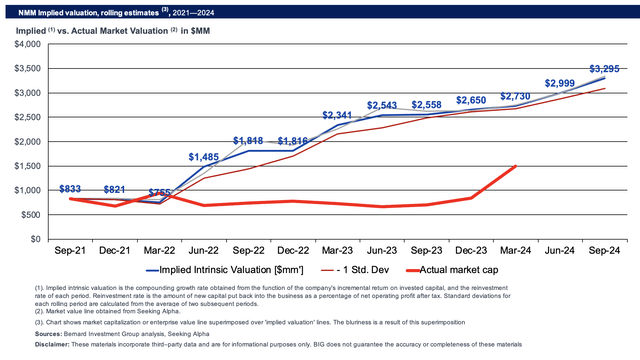
Finally, my analysis projects a large value gap between the implied intrinsic value of NMM and where it currently trades in the marketplace. Here, I compound the firm’s valuation at the function of its return on invested capital and reinvestment rates (ROIC x reinvestment rate). My projections out to 2024 are also observed. Based on this calculus, my judgement is the company is worth around $2.9 billion today, and this could stretch up to $3.3 billion by the end of the year.
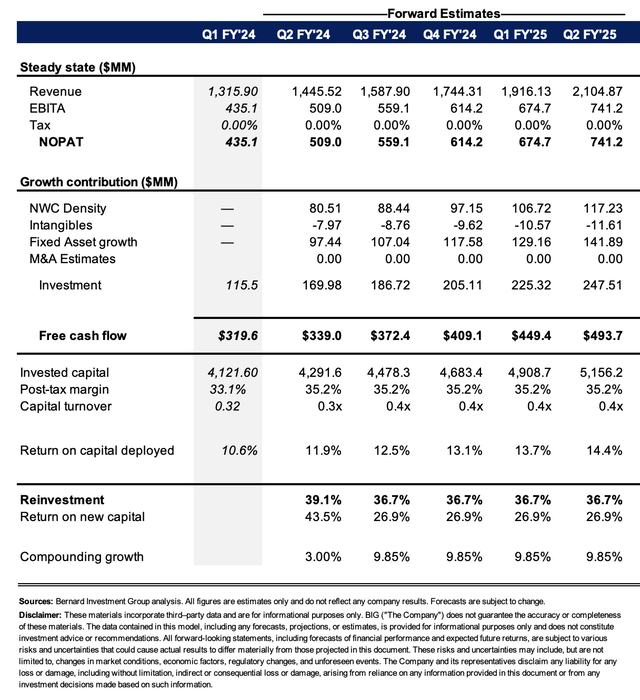
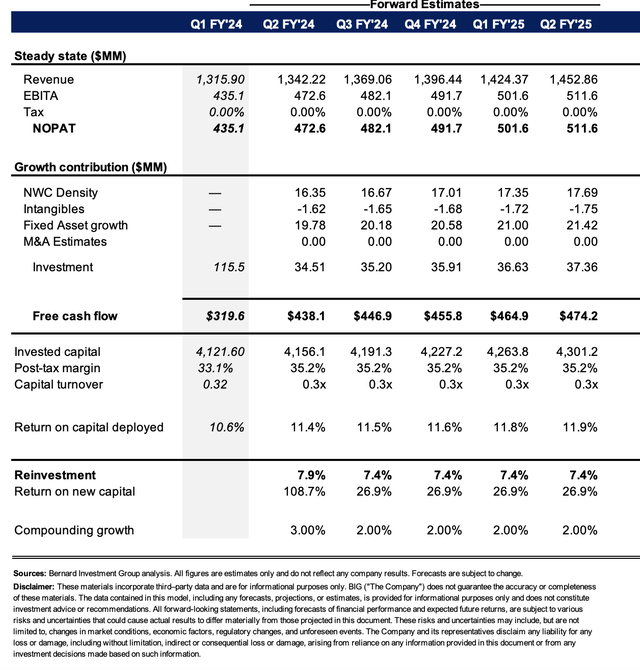
This is my upside scenario. If the company were to continue on its current trajectory, it might hit these numbers. However, I’ve also got to live in reality. A 9% growth in sales each period is unrealistic over a long period of time. Winding down the expected growth rates to align with long-term GDP (2-3%) as a “worst case” scenario, I arrive at a valuation of $45.70, around about what I pay for the stock today – four dollars less in fact. This supports a buy rating in my view. What it suggests based on my analysis is that the company is, at worst, worth about what I would pay for it today. In my best-case scenario, it is worth anywhere from 92% to 112% more than what I’d pay if my valuations are correct. Calculations are observed in the appendices.
Figure 14.
Conclusion
There are a number of industry-specific tailwinds and MM looks well positioned to capitalise on over the coming 12 2024 months. This is a business in an industry with commodity economics, that are hard to differentiate on product price. The company makes up for this shortfall through its above industry operating margins, and gross margins, which suggest it has consumer advantages that allow it to price its offerings above peers. This is well-supported in the data, including the company’s investment programs and Deep custom networks.
My analysis has the company valued at around two 900,000,000 to $3.3 billion, and trading at a discount to book value represents a statistical discount that enables the investor to increase Hazel her return and equity by buying a high-quality franchise Below liquidation value. At worst, opinion is the company is worth about what I would pay for it today, and at best it is worth multiples of. Net net rate buy.
Appendix 1. Upside scenario
Appendix 2. Base scenario


