Pgiam/iStock via Getty Images
Investment Summary
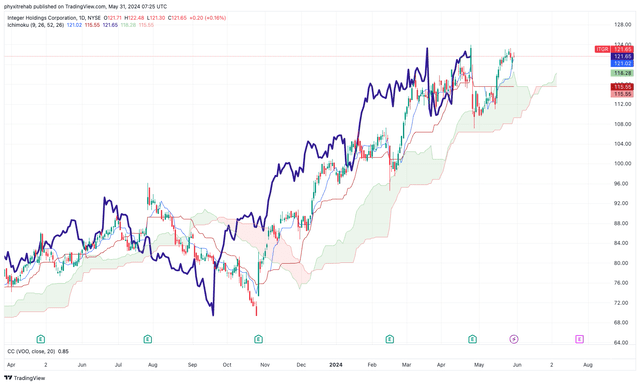
Since my last report on Integer Holdings Corporation (NYSE:ITGR), the stock has experienced a substantial re-rating, surging nearly 60% from my previous hold call. This impressive growth has propelled the stock from a modest base of around $90/share to $121/share as I write.
Figure 1.
There is no denying investors have bid up the company’s stock price and earnings multiples since the last publication. My questions now are threefold: 1) What may I have missed? 2) What’s driving the change in market value? and 3) Has the market got it right?
Here I will run through the answers to each of these questions today and link back to the broader investment debate for ITGR. Despite the gains in share price, my estimates still arrive at the conclusion of a hold on this company. This report will run through my reasons why. That is not to say that (i) I am at all correct, or that (ii) ITGR stock won’t continue to gain in the future. But, based on our first-principles investment thinking here at Bernard, there is a misalignment to what we can comfortably allocate to the company. Net-net, I continue to rate ITGR a hold for reasons outlined in this report.
Q1 FY’24 earnings decomposition
ITGR grew sales 10% year over year in Q1 ‘24 to $415 million, with c.600 basis points of this delivered by the underlying business. It pulled this to adj. operating income of $63 million, up 26% on last year, and earnings of $0.20 per share, down from $0.59 the year prior.
Management revised up FY’24 full year guidance following the strong quarter. It now eyes 9–11% top line growth this year, calling for $1.77 billion in revenues at the upper end (up 200 basis points from previous). It is looking to adj. EBITDA on this of $375 million at the top end of range, and might clip earnings of $171-$185 million, up 8–18% if it does occur. Finally, management looks to invest around $110 million to capital expenditures for the year (6.2% of est. sales; $3.28/share).
The divisional breakdown was as follows:
- Cardio & vascular sales were up 16% year over year to clip $221.8 million. Management said demand was strong across all the segment’s markets, with upticks in electrophysiology and structural heart applications.
- Cardiac rhythm management and neuromodulation sales grew 770 basis points over the year to $156.2 million. There were no major growth drivers mentioned by management in the segment during the quarter. Growth was strong nonetheless in my objective view.
- The surgical orthopaedic and portable medical business was up 4% percent on the year and put up $29.1 million in revenues. As a reminder, management are exiting the portable medical business over the next few years.
Figure 2.
Company filings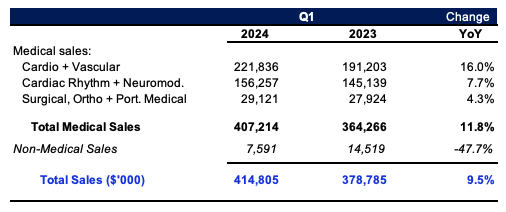
In my view this was a reasonably strong quarter from ITGR and growth numbers were above historical range. For instance, last 12 month sales growth of 13% is above the company’s five year average of 5.5%, and nearly double the sector median of 7%.
Consensus expects strong growth rates from the company moving forward as well. It projects 31.6% forward growth in pre-tax income this year, off sales growth of 10% in 2024, in line with management forecast. Wall Street is eyeing 13 to 14% bottom line growth over the coming two years respectively.
With this kind of top and bottom line momentum building for ITGR, it would be unwise not to make revisions to my modelling, which I discuss below.
Backdrop of fundamentals
In my last two publications on the company, I have spent extensive time illustrating its core fundamentals, business lines, key risks, industry outlook, and competitors. (You can check my analysis on the company from August + February 2023 by clicking here, and here respectively). I’m going to piece a few more of the moving parts of the investment debate together for the benefit of our readers today.
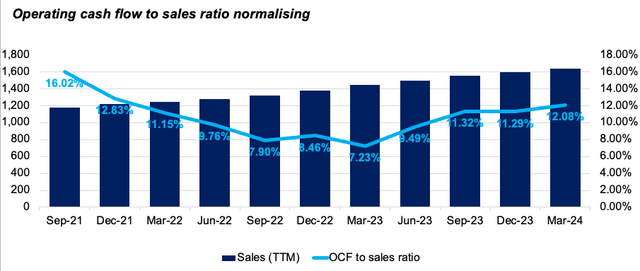
As seen in Figure 3, sales have been growing at a reasonable clip each period on a rolling 12 month basis since 2021. The operating cash flow to sales ratio, measured as the rolling 12 month cash from operations against sales, saw significant contraction across the 2021 to 2023 period. It fell from 16% of revenue to around 7% in Q1 2023. One potential standout is that, as revenues have continued their advance, so who has the amount of operating cash flow the company has realized. The ratio is subsequently normalising to a long-term range of 12% to 14% percent.
Figure 3.
As to what is driving the change in market value, it would appear that this is a combination of both earnings growth and change in the P/E multiple.
Figure 4 tracks the company’s P/E multiple and rolling earnings per share on a 12 month basis since 2021. As seen, there was a large dislocation in price (P/E) relative to earnings throughout 2022 and 2023, But since management has grown quarterly earnings from $2.00 per share up to $2.90 per share in last 12 months, investors have continued to bid up the subsequent earnings multiple as well. At the time of publication, the company trades at 42x trailing GAAP earnings, and 24.6x trailing non-GAAP earnings.
So it suggests that 1) management are growing earnings, and 2) investors are paying higher dollar values for one dollar of those earnings.
Figure 4.
BIG Investments, company filings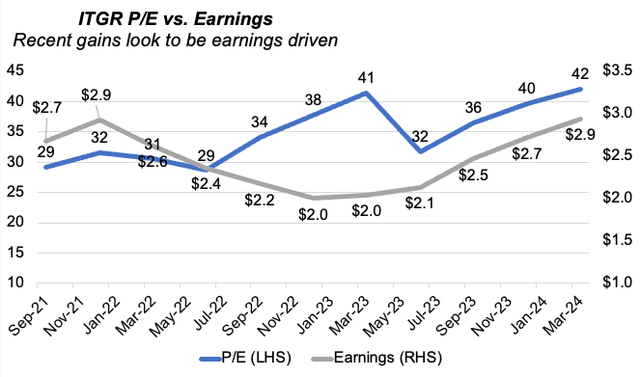
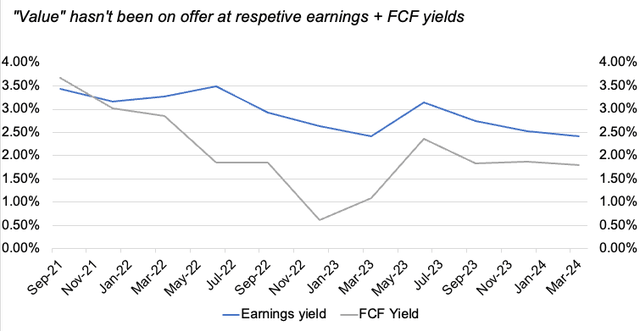
The value investor’s have received from this type of exuberant activity is not noted in Figure 5. The respective earnings and free cash flow yields have been decreasing steadily since 2021, despite no obvious change in the company’s market value until 2024. Investors have paid the respective P/E multiples shown above, realising decreasing yields of around 100 basis points on earnings, and nearly 350 basis points on free cash flow.
Critically, I can say that I have not missed any parts of the fundamental story, or the growth story. I am just at odds with how the market has priced this company in the last six months.
Figure 5.
Outcomes of modelled scenarios
I mentioned consensus growth estimates earlier. These aren’t unreasonable figures in my view, especially given 1) the recent sales growth the company has exhibited, and 2) uptick in growth in the cardio and vascular business, driven mostly by sales of its post field ablation (“PFA”) devices.
If management were to hit the estimated growth of 10% in sales + 31-32% growth in pre-tax income this year, this would imply a pre-tax income margin of 17.5%. (This is roughly 300 basis points above 2023).
This cannot be overlooked. Business returns – that is, returns on existing and incremental capital – are driven by the combination of operating margins (post-tax), and turnover of sales on invested capital. ITGR does not enjoy favourable economics in this regard in my view. Post-tax margins of around 13% produced on capital turnover of 0.6x results in a return of 7.3%. This is consistent with the average 7% ROIC management has produced over the last three years each period.
An increase of operating margin to the 17% level combined with added sales growth could be a positive inflection point on its share price. I’ve therefore got to get some scope on what this could mean for the company going forward.
Figure 6.
Seeking Alpha, BIG Investments 
Figure 7 depicts management’s capital allocation decisions over the past three years alongside the financial results of the business. It does this on a rolling 12 month basis. Sales have grown at around 3.3% each period, with pre-tax margins of 14.4%. To produce a dollar of sales growth, management has had to invest $1.19, or $1.60 including all acquisition activity. This is distributed across all areas of capital. For instance, it required $0.40 on the dollar of investment to working capital and around $0.55 of investment toward fixed assets to produce an incremental $1.00 of revenue.
Figure 7.
Company filings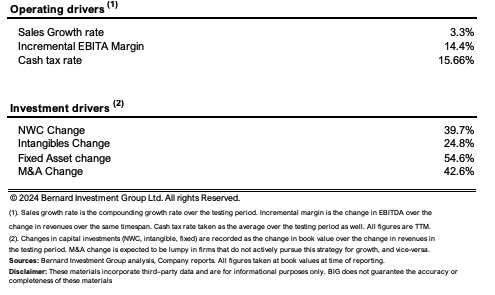
If management were to continue along those lines, without deviating too far from recent history, my estimates project the company could do roughly $1.7 billion in sales in 2024, and around $1.92 billion in 2025. This is in line with consensus estimates. I would also call for pre-tax earnings of $250 million this year, stretching up to $278-$280 million the following year. This could result in strong free cash flow production of around $100 million-$150 million under these assumptions. Management projects around $105 million in free cash flow this year.
If this were the case, as I discussed in my valuation points later, this is not an attractive proposition to us.
Figure 8.
BIG Investments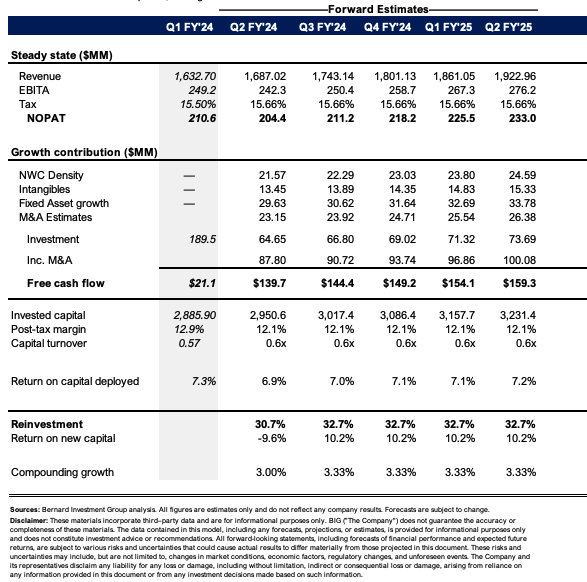
The Question: how do the perceived changes in outlook change the investment debate, if at all? Here, I am going to carry an 8% average growth rate going forward, and an incremental pre-tax margin of 17%. These are in line with my estimates and reflect Wall Street’s view as well.
The changes are quite drastic. I get the company at $1.7 billion – $1.9 billion in sales this year, stretching to $2.4 billion by 2025 on pretax income of $424 million. It could still spit off $100 million-$150 million under these assumptions, thanks to the higher growth rate and operating margin feeding more cash down the P&L and to shareholders at the end of the day or for reinvestment.
As I will discuss below, this has quite a substantial change on valuation, but, critically, not enough for me to believe it is undervalued.
Figure 9.
BIG Investments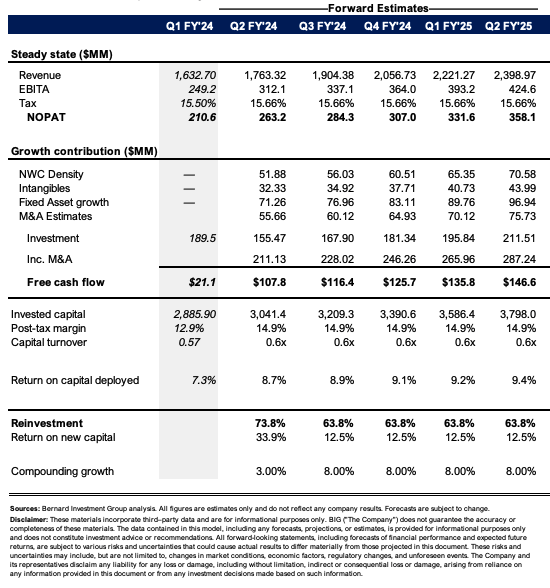
Valuation
As it relates to valuation ITGR currently trades at 24x training earnings as mentioned earlier. It also sells at around 27x trailing EBIT. Both of these multiples are large premiums to the sector of 27% and 20% respectively.
My question from earlier was, has the market got it right. To this, I’m first going to see if it has got it right up until date. For this, I benchmark the company’s incremental return on capital, multiplied by the amount reinvested at these rates, and then compare this to the total change in share price since Q3 2021. This is on a rolling 12 month basis.
Over this time, management has invested an incremental $9.60 per share back into the business to engender an additional $1.40 per share of post tax earnings, otherwise 14.4% incremental return on investment. Over the same time, the ITGR share price climbed by 17.3%, right before the breakout at the end of Q1 2024. In my view, the market had priced the company correctly up until this point, and this was reflected in my prior analyses.
Figure 10
Bernard Investments 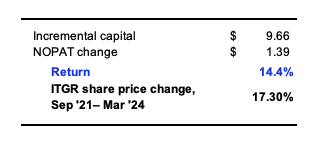
Now the stakes are now different and obviously there is more optimism priced into the stock at its current levels. I’m going to tackle this in a number of ways.
First, I’m going to project my estimates of free cash flow out over the coming 10 years, at the adjusted rate of growth and margin. I then discount this back at a rate of 12%, reflecting the opportunity cost of the long-term market averages. I blend this with a model that compounds the valuation at the function of return and invested capital and reinvestment rate (ROIC x reinvestment rate).
Doing so, I get to a blended valuation of $113 per share, below where the company trades today as as I write. This is supportive of a neutral view, with the revised growth assumptions baked in.
Figure 11.
Secondly, I want a good understanding of how economically valuable these earnings and cash flows actually are to us relative to an opportunity cost. To be economically valuable, the post tax earnings need to be produced at a rate above 6% invested capital moving forward. This is in line with the current starting yields on most investment grade corporates. Anything above this stipulated figure would be considered economically valuable. For instance this year, it would need $182.5 million in post tax earnings in order to hit this threshold. My numbers project it could do $263 million at the new growth and margin rates, leading to “economic profit” of $80.75 million, $2.41 per share. I then sum these projections from the next five years, and discount them at the 12% total rate from before.
I get to a valuation of $130 per share doing this, marginal upside on today’s values. What this means is that the economic profits I would hope to strip out of this company over the coming five years, when capitalised at the 12% rate, only amount to a figure roughly $9 per share above where it trains today. This is not enough margin of safety to get us interested here, even with the revised growth and margin assumptions.
Figure 12.
BIG Investments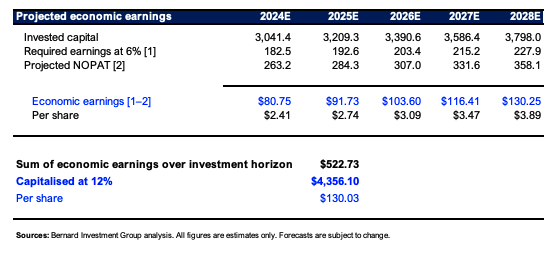
Finally, I wanted to run through a number of scenarios to see what would happen if the high multiples were to contract, or if growth numbers were not hit. As seen below, if management does hit consensus growth estimates of 13.4% in EPS this year, and there is no change in the P/E multiple, the stock would be worth around $130 to us today – exactly where I get to when considering my revised estimates. If the multiple were to contract back to 20x, and it still hits the growth numbers, then the stock would be worth $105 to us today, illustrating how sensitive it is to a contraction in multiples. Similarly if it misses growth and prints 8% expansion at the bottom line this year, this gets us to $123 per share, marginally above where we trade as I write. So even if investors do pay that multiple, and it misses, it might be fairly valued. It is all in the multiple, and not necessarily in the fundamentals in my opinion.
Figure 13.
BIG investments 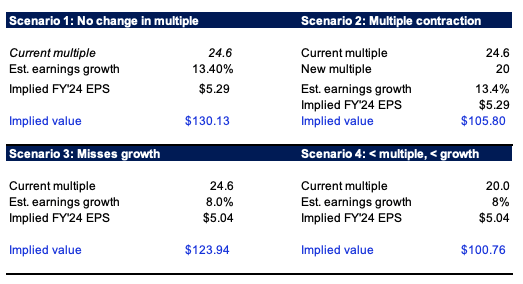
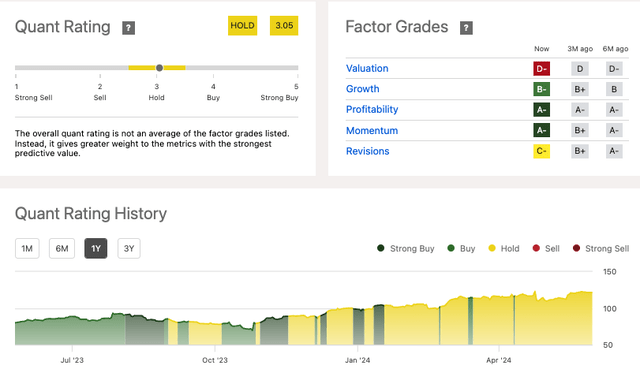
As a result, just like the Seeking Alpha quant system shown below, I am reiterating my stands on ITGR as a hold on grounds of economic value and valuation.
Figure 14.
Conclusion
Investors continue to pay high multiples for ITGR. This has led to a substantial repricing in its market value since my last publication. However, I cannot wrap my head around paying more than 40 times reported earnings, with trailing returns of capital of 7%, and a lack of economic value to be drawn from this name based on my analysis. From the culmination of these views, I reiterate my stance on the company as a hold and look forward to providing further updates.


