Klaus Wedfeldt
Technology was the market’s worst-performing sector last week, as disappointing results from Salesforce and Dell Technologies prompted profit-taking among the most influential groups and ended a five-week winning streak for major market averages. The downward revision of first quarter economic growth from 1.6% to 1.3% also made things worse, especially considering that the decline was driven by slowing consumer spending growth. We should warn that as deinflationary trends develop as economic growth slows, the doomsayers will stop warning about inflation and resume calling for a recession, since an elusive soft landing is not in their playbook. But that’s OK, because this bull market needs a wall of fear to overcome as we enter the mid-cycle slowdown phase of the expansion.

Edward Jones
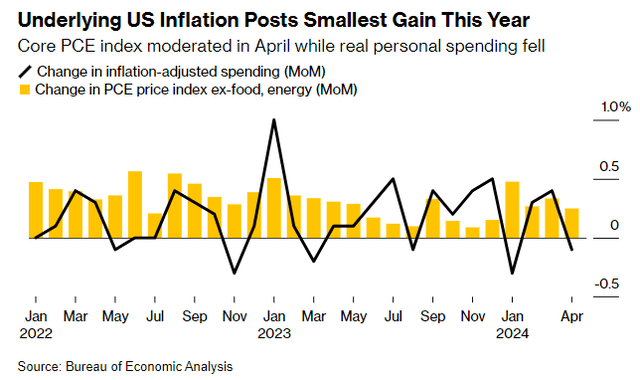
Last week ended on a positive note as April inflation data was in line with expectations and confirmed the disinflationary trend. The core personal consumption expenditures (PCE) price index rose 0.2% to a 2.8% annualized rate for the third consecutive month. While it has halted its downward trend over the past three months, personal consumption fell 0.1% in inflation-adjusted (real) terms in April, while spending on services rose just 0.1% in real terms. Thus, we are seeing a precursor to lower inflation in the form of reduced demand for goods and services.
Bloomberg
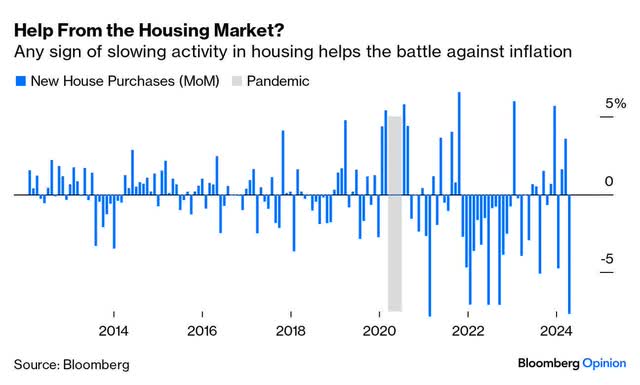
This isn’t just limited to goods and services: Price pressures are finally easing in the housing market, with homebuyers balking at new properties that don’t factor in 7% mortgage rates. As a result, owners are lowering their listing prices to a degree not seen since late 2022. Redfin Businesses. This indicates that interest rates are rising to drive down inflation. As activity slows, inventory should begin to increase more noticeably and the market should rebalance in favor of buyers over sellers, causing pending home sales to increase again. The rate of change here is becoming less negative, which is positive.
Bloomberg
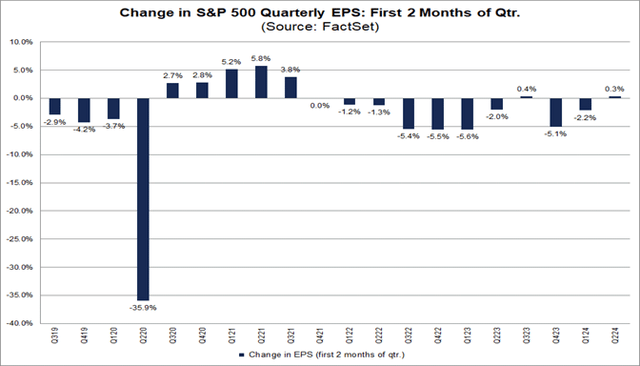
Lower inflation is accompanied by lower economic growth, and bears are warning of a recession, as we saw with the revised Q1 GDP numbers. Let’s also not forget that S&P Global’s services and manufacturing PMI survey two weeks ago showed a spike in activity in May. We’ll be watching to see if this week’s ISM survey confirms that strength. A good sign that growth is sustaining are the second quarter corporate earnings forecasts, which were raised by analyst consensus in April and May. This is not something we typically see except when coming out of a recession, where the consensus tends to be overly pessimistic.
FactSet
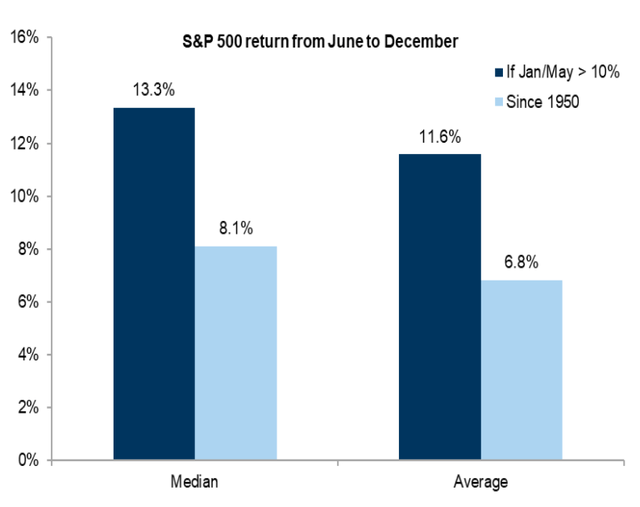
A soft landing is about striking a balance between enough growth to sustain the expansion and a slowdown in growth rate enough to bring down inflation. I believe we remain on track, but the market is the best leading indicator along the way, and its performance so far is a positive sign. In support of my bullish outlook, I came across another encouraging statistic for the remainder of 2024. In the past 74 years, the S&P 500 has risen 10% or more in the first five months of the year 21 times. The only two times the index fell, occurring in 1987 (-13%) and 1986 (-0.1%), the average gain over the remaining 19 years was 11.6%. I don’t use statistics like these to formulate my fundamental outlook, but when I come across these statistics after I have already solidified such an outlook, it gives me confidence that I am moving in the right direction.
Bloomberg
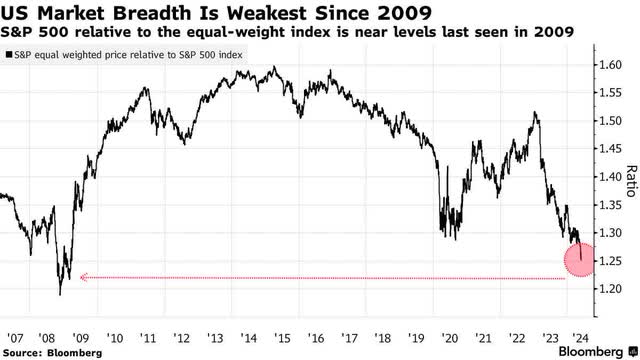
Now consider that the performance differential between the market cap weighted S&P 500 Index and its equal weighted version is now at an extreme not seen since 2009, which was one of the better times to invest in average stocks in recent years. With the Magnificent 7’s earnings growth slowing dramatically between now and the end of the year, I believe this is a harbinger of a rotation out of Technology into all other sectors of the market, while the rest of the market’s growth rates are slowing but increasing sequential growth rates. This should narrow the performance differential seen in the chart below and widen the market’s breadth.
Bloomberg


