By Søren Karau and Johannes Fischer, Senior Economists (Balance of Payments, Exchange Rates, Capital Market Analysis) at the Economics Department of the German Bundesbank. Economist in the Economics Department (Balance of Payments, Exchange Rates and Capital Market Analysis) at the German Bundesbank. It was first published in VoxEU.
There is great uncertainty about the economic effects of President Trump’s second term. This column assesses the potential impact of Trump’s victory in the upcoming election through the perspective of financial market participants. The authors find that investors associate a higher probability of a Trump victory with negative net supply-side effects. In the United States, the growing prospect of a Trump victory in gambling markets is associated with falling stock prices, rising interest rates, and rising market-based inflation compensation. These inflationary pressures are also reflected on the other side of the Atlantic in the form of increased inflation compensation in the euro area.
Although some of Donald Trump’s policy proposals have the potential to have significant macroeconomic impacts, there is great uncertainty about the (net) economic impact of a second Trump term. For example, will the US dollar appreciate due to new tariffs, or will it depreciate as President Trump reiterates his opposition to a strong dollar? And what does Trump’s victory mean for US growth and the ongoing disinflationary process in both the US and the euro area? As Albari and his co-authors demonstrated in a recent VoxEU contribution, this uncertainty is already leading to increased volatility in financial markets as elections approach (Albari et al. 2024). Extending their analysis, this column uses betting market data from a VAR model to assess the economic impact of a second Trump term from the perspective of financial market participants.
Measuring Trump’s odds of winning using betting data
We use data from prediction markets to directly measure the market’s evolving assessment of Trump’s prospects for victory. These markets allow participants to bet money on specific events, such as election results. Like other financial market prices, betting quotes contain all kinds of information that can influence the outcome of a bet, and Moramarco and his coauthors discuss political risks in their contribution to Vox. (Moramarco et al. 2020). The analysis uses the implied probability of Trump winning in the upcoming US presidential election provided by PredictIt and PolyMarket (averaged and provided by Bloomberg).
Comparison with election poll data used by Alboli et al. (2024) – Betting odds have several advantages. First, it explains the peculiarities of the US electoral system, such as the Electoral College.1. For example, improved voting numbers do not necessarily translate into improved chances of actually winning an election.2. Second, poll data is collected over several days and released on a staggered basis. 3. In contrast, betting odds react almost immediately to election-related news in an information-efficient manner.
But President Trump’s odds of victory, and the implicit betting quote, pose a problem of identification as they generally react to all kinds of news and economic trends. For example, the release of alarmingly high U.S. inflation rates could signal continued price pressures weighing on the current administration’s economic performance, making a Democratic victory less likely. There is a possibility. To the extent that inflation surprises signal tighter US monetary policy, asset prices could fall. Therefore, the observed simultaneous changes in betting odds and asset prices are important for what we are ultimately interested in: the causal effect of changes in President Trump’s chances of winning the election as interpreted by financial markets. Not necessarily beneficial.
We solve this identification problem by exploiting the real-time nature of betting markets. Specifically, we measure high-frequency changes in Trump betting odds before and after major election-related events (see Table 1).4. These events clearly influenced the market’s assessment of the likelihood of a Trump victory, but were independent of other factors such as economic conditions. This allows these high-frequency movements to be used as instrumental variables in financial market VARs. This is explained below.5.
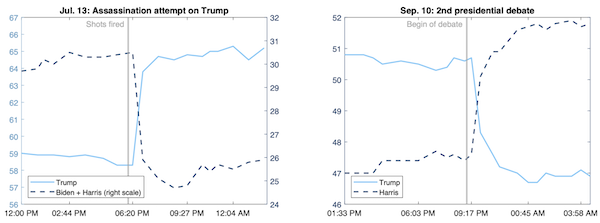
Figure 1 Betting odds on two major election-related events

Note: Trump (light blue) vs. Harris/Biden (in light blue) in the 2024 US presidential election, derived from prediction markets for the July 13 assassination attempt (left panel) and the second presidential debate (right panel). dark dashed line) implicit probability of winning. Value in percent. Times refer to Easter Daylight Time (EDT, Washington, DC).
sauce: ElectionBettingOdds.com, author calculations.
To illustrate this approach, Figure 1 shows the evolution of betting odds for two such election-related events. The left panel focuses on the July 13 assassination attempt on Trump and shows the implied probabilities of a Trump victory alongside the implied probabilities of a Biden or Harris victory. Hours before the event, Trump’s chance of victory had held steady at about 59%. But after news of the failed attempt on Trump’s life and his defiant reaction in its aftermath broke around 6:30 p.m. EDT, the odds jumped to about 65%. The odds of a Biden/Harris victory have declined accordingly. The right panel shows that Harris’ chance of victory increased by almost 4 percentage points before and after the second presidential debate on September 10, consistent with the perception that Harris delivered a more convincing performance. It shows that.6. Notably, both events occurred during times when other US markets were closed (weekends and evenings, respectively), so other US news or data releases are unlikely to explain the observed spikes.
Table 1 Events used to build instruments

Note: The third column shows the change in President Trump’s probability of winning in the two to three time frames before and after each event, which we use as the recent indicator value.
sauce: ElectionBettingOdds.com, author calculations.
The causal relationship that an increase in the probability of President Trump winning in the structural financial market model has on financial markets
We estimate a financial market VAR model that includes daily observations of eight variables from January 1 to September 13, 2024.7. As outlined, the first variable measures the probability that Trump wins the election, expressed in log odds. Additionally, the model includes two-year Treasury yields, (log) S&P 500, and (log) Euro-Dollar exchange rates to capture important aspects of the U.S. economy. Additionally, we add the price of an asset that could conceivably benefit from a Trump victory, as has been well reported in the financial press (the logarithm of the Trump Media & Technology Group (DJT) stock price vs. Bitcoin consideration).8./sup> Finally, we include market-based inflation compensation (inflation-linked swaps) in the US and euro area over the next 24 months as a measure that captures true inflation expectations and associated inflation risks.
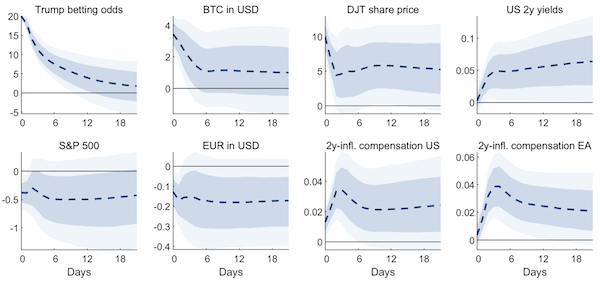
Tools derived from high-frequency movements in betting odds allow you to identify and track dynamic effects on betting odds. Trump’s election probability shock. Figure 2 shows that a 20% increase in the log odds of Trump winning the election (equivalent to a 5 percentage point increase in the probability of victory) increases the so-called Trump’s trade Importantly, the price of Bitcoin rose more than 3% as a result, and DJT’s stock price increased by almost 10%. We interpret these results as lending confidence to the underlying identification scheme.
The increasing possibility that Mr. Trump will win the presidential election will also have a significant impact on major U.S. financial market prices. The shock is likely to push U.S. two-year interest rates up about 5 basis points, while the S&P 500 is likely to fall by nearly 0.5%, at least initially. The same applies to the EUR/USD exchange rate, suggesting an immediate euro depreciation.9. Notably, both the US and Eurozone two-year inflation swap rates rose, reaching a peak response of almost 4 basis points.
Figure 2 Impulsive response to the probability shock of President Trump winning

Note: Impulse response of a daily financial market VAR model to an exogenous shock to the probability of Trump winning the US presidential election. It was normalized to increase the log odds of Trump by 20% (equivalent to a 5 percentage point increase in the implied probability). All values are percentages (age points). Dark shaded areas indicate confidence bands of 68% and light shaded areas indicate confidence bands of 90%.
Taken together, these impulse reactions suggest that market participants associate President Trump’s victory with a rather contractionary supply-side effect on the supply side. This interpretation is consistent with standard macroeconomic theory in that some of President Trump’s policy proposals (imposing additional tariffs, deporting immigrants) will increase price pressure but also depress potential U.S. output. will match. If demand-type effects were to dominate instead, the observed rise in inflation expectations would be expected to be accompanied by a rise in broad-based stock market valuations. Expectations for two-year interest rates to rise can be rationalized by expectations that US monetary policy will tighten in response to rising inflationary pressures. Finally, the weaker euro is consistent with expectations that President Trump will increase tariffs not only on Chinese goods but also on European goods (Jeanne and Son 2024). This weakening of the euro, along with the rise in import prices due to tariffs, will also bring inflationary pressure to the euro area.
footnote
1. In the electoral system, each state is allocated a certain number of electors, who elect the president. This means that it is not the national vote count (popular vote) that matters. Instead, the election will actually be ultimately determined by the voting results of certain key states.
2. Polling data must be compiled from a variety of national surveys and surveys conducted in each U.S. state, which has different weight to the actual election outcome due to its electoral system.
3. Albori et al. (2024) use this feature of voting data for identification. However, because there are often consecutive days when no new polls are published, using poll data can introduce measurement error and widen confidence bands.
4. To that end, we collect raw data from electionbettingodds.com, a website that averages betting odds from several prediction markets.
5. This measure corresponds to the change in the implied election probability in a short time window around the event and is zero on all other days. Such an instrumental variables approach reflects the approach that has become standard in empirical macroeconomics, for example to identify shocks to monetary policy (see, e.g., Gertler & Karadi, 2015). Intuitively, it isolates the variation in the time series due to the shock of interest rather than other confounding factors. The F statistic of the regression of the model residuals on the instrument > confirms the high association of the instrument. 30.
6. The Economist points out that viewers saw Kamala Harris as the winner of the debate in instant polls.
7. As a result, this sample does not cover the recently observed divergences between individual prediction markets. Specify five lags corresponding to one week and use standard Bayesian Minnesota-type priors.
8. Trump has repeatedly voiced support for cryptocurrencies in recent months, reportedly claiming that he would be the “crypto president” if elected. This followed his attendance at a Bitcoin conference in Tennessee in July and the launch of his own cryptocurrency project, World Liberty, in which he serves as his own “chief crypto advocate” in September. It reached its climax at the top. There was also talk of plans for the U.S. government to introduce a “strategic Bitcoin reserve regime” in which it would purchase Bitcoin as a reserve asset.
9. Both of these responses of stock prices and the Euro-dollar exchange rate become larger, more persistent, and much more statistically significant when we estimate the model starting after March 2024.


